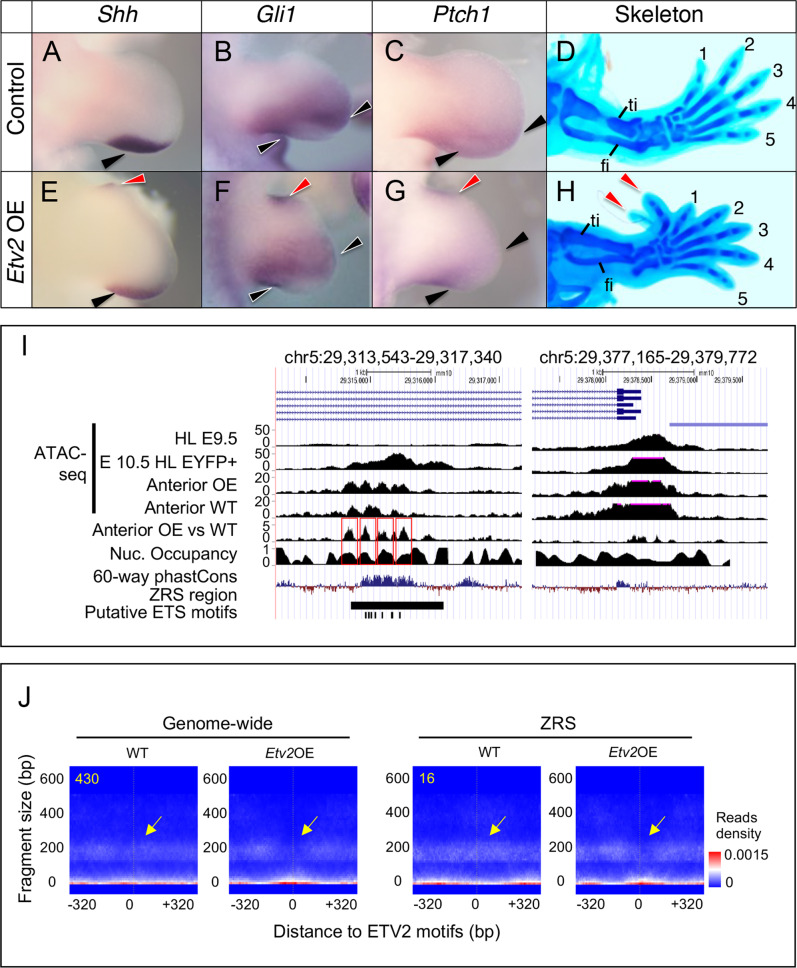
Fig. 5. Overexpressed ETV2 displaces chromatin of limb enhancers, ectopically activates SHH signaling, and induces polydactyly.
A–H Overexpression of Etv2 resulted in ectopic induction of SHH signaling in the anterior domain and formation of extra digits. Control embryos [HoxB6-Cre+/+; iHA-Etv2Tg/+; ROSA26-STOP-rtTA-IRES-EGFPTg/+] (A–C) and Etv2-overexpressors [HoxB6-CreTg/+; iHA-Etv2Tg/+; ROSA26-STOP-rtTA-IRES-EGFPTg/+] (E–G) were analyzed at E11.5 for expression of Shh (A, E), Gli1 (B, F), and Ptch1 (C, G). Skeletal patterns of E15.5 embryos were analyzed by Alcian blue staining (D, H). Black arrowheads in A–C and E–G indicate normal expression domains, and red arrowheads indicate ectopic induction in anterior domains (E–G). Red arrowheads in H indicate ectopic digits formed anteriorly. The phenotypes were observed in hindlimbs in the following frequencies: Shh: two out of four embryos; Gli1: two out of three embryos; Ptch1: two out of three embryos; bilateral polydactyly: two out of three embryos. No ectopic induction or polydactyly was observed in forelimbs. I Overexpression of Etv2 resulted in depletion of nucleosomes at the ZRS. For the Anterior OE and WT tracks, hindlimbs from three embryos were analyzed by ATAC-seq separately and averaged. HL E9.5 and E10.5 HL EYFP+ tracks show the ATAC-seq signals of E9.5 hindlimb and Etv2-EYFP+ samples from E10.5 HL, respectively. The Anterior OE and Anterior WT tracks are ATAC-seq tracks excluding the nucleosome free reads (fragment size > 150) of the anterior Etv2OE samples and the WT anterior samples. The Anterior OE vs WT track shows the ratio of the ATAC-seq signals of the anterior Etv2 OE samples and the WT anterior samples. The Nuc. Occupancy track shows the nucleosome positions in the WT anterior samples. J The aggregated V-plot of 430 ETV2 motif-centric regions and 16 ETV2 motifs present in the ZRS region in the ATAC-seq data were significantly different (Adjusted p-value < 0.05) between Anterior WT and Anterior Etv2OE samples. The aggregated V-plots shows an increase of nucleosome free reads in the Anterior Etv2OE samples as compared to the Anterior WT samples. A chi-squared test with K degree of freedom (where K is the size of the latent variables) was used to compute a p-value of the difference between two V-plots. The Benjamini-Hochberg Procedure was used to adjust the p-value for multiple comparisons. The heatmap color indicates the estimated read density for estimated read counts (right). Yellow arrows point to the genomic regions changing from nucleosome-occupied to nucleosome-free from WT to Etv2 OE samples. Sex of the embryos were not determined in these experiments.

