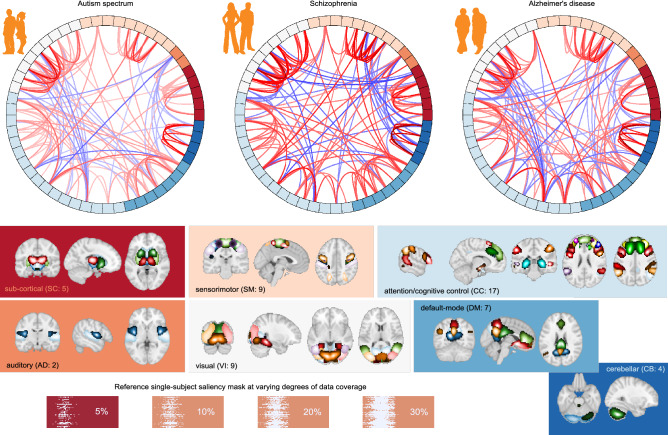
Figure 4.
Top 10% FNC for patients computed using most 5% of the salient data as thresholded using feature attribution maps (saliency maps) for different disorders (created in programs MNE 1.1.dev0, https://mne.tools/dev/ and Inkscape 1.1.2, http://inkscape.org/release/inkscape-1.1.2). Apart from the high predictive capacity of the salient data, we observed some intriguing differences among these connectograms. The autism spectrum disorder exhibits the lowest between-domain FNC. However, salient data in autism disorder highlights domain changes in specific cerebellum, sensorimotor, and subcortical domains. The model-identified salient data reflects the most widespread pattern for schizophrenia and is consistent with the literature showing cerebellum interaction across multiple domains and sensorimotor changes. The predictive features for Alzheimer’s disease mainly concentrate on visual and cognitive interactions.

