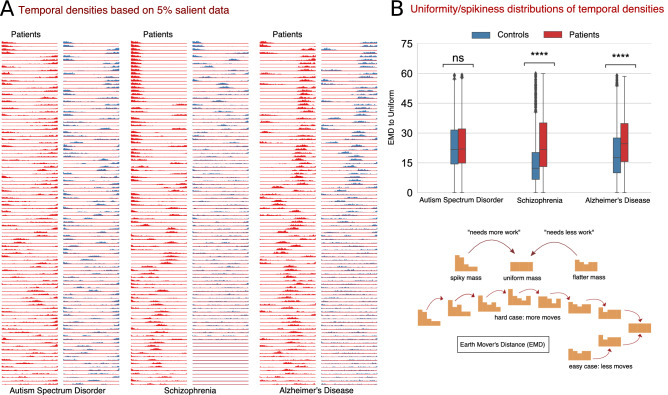
Figure 6.
(A) Examples of the temporal density based on the top 5% values of the saliency maps from patients and controls for each disorder. It is noticeable that the temporal density for schizophrenia and Alzheimer’s patients is more focal in time as reflected in the spikiness, indicating that the discriminative activity for patients occurs predominantly in a shorter time interval. In contrast, for controls, model predictions do not relate to specific time intervals. For autism spectrum disorder, however, the whole MILC model did not capture any temporal adherence to the discriminative activity for patients. That is, the discriminatory events are not focal on shorter time intervals for ASD. (B) The EMD (Earth Mover’s Distance) distributions as a proxy measure for uniformity/spikiness of temporal densities (edited in program Inkscape 0.92.2, http://inkscape.org/release/0.92.2/). We analyzed the EMD measures of patients and controls to investigate the discriminative properties of salient data in terms of the spikiness or uniformity of the temporal densities. The larger EMD measures for schizophrenia and Alzheimer’s patients substantiate that the model found the discriminative activity in shorter focused time intervals. In contrast, for ASD, the equal EMD values for both patients and controls indicate that the temporal density measures do not relate to the discriminative activity for this disorder. We verified these observations with the statistical significance (Wilcoxon rank) test results as marked by asterisk (*) and “ns” (not significant), where , .

