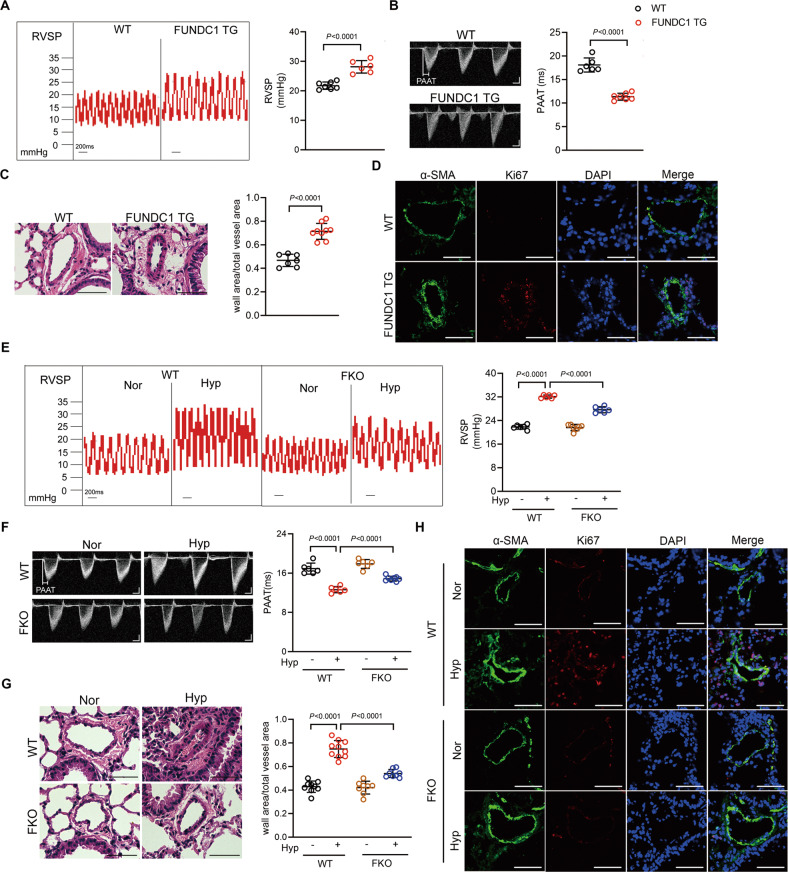
Fig. 5. Increasing mitophagy results in mouse pulmonary hypertension (PH) and inhibition of mitophagy ameliorates mouse hypoxic PH.
A Right ventricular systolic pressure (RVSP) and B pulmonary artery acceleration time (PAAT) of wild-type (WT) and Fundc1 transgenic (FUNDC1 TG) mice. n = 6–7 mice per group. C The representative pulmonary artery images in the lung sections. n = 7–9 mice per group, scale bar: 50 μm. D Immunostaining of lung sections from WT and FUNDC1 TG mice with indicated antibodies. Green: α-SMA; red: Ki67; and blue: DAPI. scale bar: 50 μm. E RVSP and F PAAT of WT and Fundc1 knockout (FKO) mice exposed to hypoxia for 3 weeks. n = 6–7 mice per group for E, and n = 6–8 mice per group for (F). G Pulmonary arterial wall thickness and H Ki67-positive cells in pulmonary arteries from WT and FKO mice under normoxia or hypoxia. n = 8–10 mice per group for G, scale bar: 50 μm. Data are presented as mean ± SD. Two-tailed unpaired Student’s t test and one-way ANOVA were used to compare two and multiple groups. Bonferroni post hoc analysis were carried out after ANOVA.

