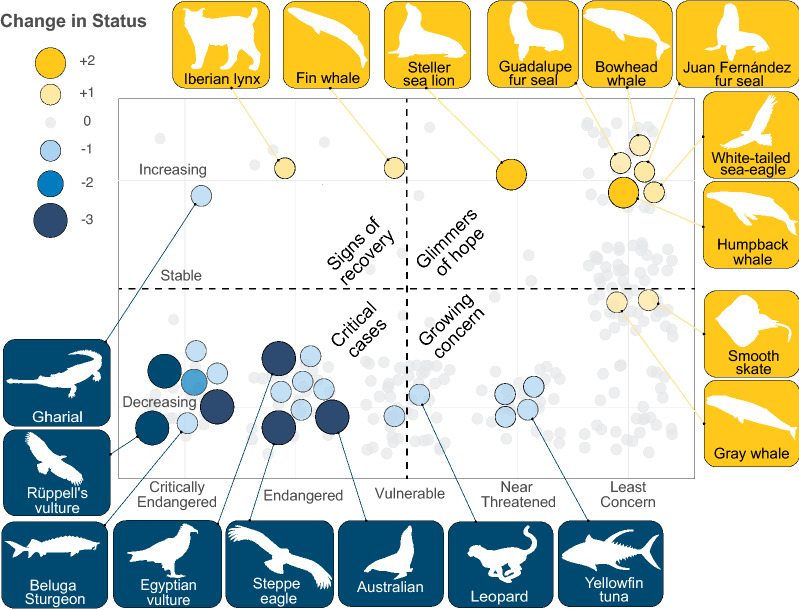
Figure 3.
Glimmers of hope and critical cases. Distribution of large carnivore species across categories of current IUCN status (x-axis) and population trend (y-axis). Improvements in status are indicated by gold and declines by blue, with bubble size indicating the number of status category changes. The majority of species have not undergone any changes in status (shown in light gray). Note: No change in status may indicate lack of recent assessment, insufficient data, or, in the case of species designated Least Concern, effective conservation efforts.

