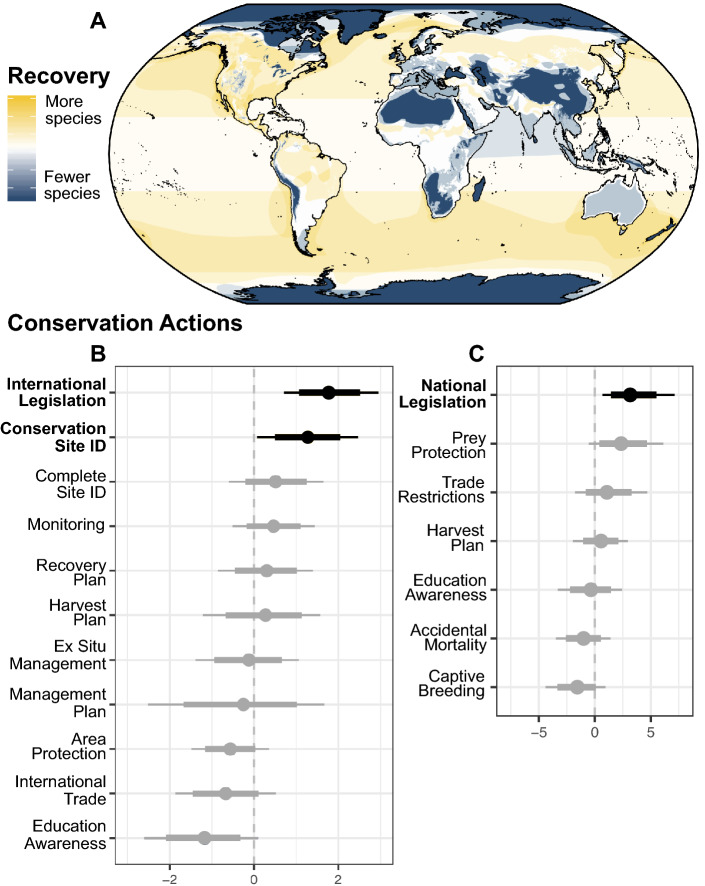
Figure 4.
Large carnivore recoveries and associations with conservation actions. (A) Geographic variation in the number of large carnivore recoveries, defined as an increasing population trend or improvement in status since initial IUCN assessment (cumulatively, recovery metrics). IUCN range maps of species meeting either criterion were overlaid, and color indicates the absolute number of recovering species in each 5 km cell. (B) For IUCN-defined ‘Conservation actions in-place,’ the change in the log-odds of showing an increasing trend for species subject to each conservation action (see Table S5 for definitions). Points to the right of the dashed vertical line (black) indicate a significant positive association, Gray points indicate that confidence intervals overlap zero. Parameter estimates are coefficients of a binomial logistic regression model (with all other conservation actions included), 95% confidence intervals (thin lines), and 90% confidence intervals (thick lines). (C) For author-defined conservation actions (see “Methods”, Table S5), the change in the log-odds of a positive outcome of either recovery metrics. Not shown: IUCN-defined actions and improved status (significant positive associations: International Legislation and Harvest Plan).

