Figure 5.
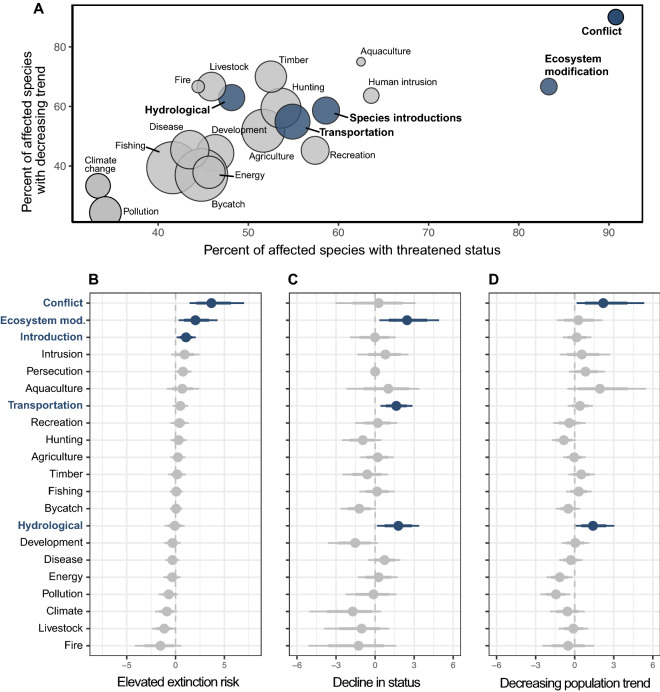
Ongoing declines and associations with anthropogenic sources of threat. (A) 23 anthropogenic threats (see descriptions in Table S6) plotted according to the percent of species affected by the threat with threatened status (x-axis) and with decreasing population trend (y-axis). The size of each point indicates the absolute number of species affected, ranging from fishing (n = 128) and bycatch (n = 125) to fire and aquaculture (n = 9 and 8, respectively). Points in blue are associated with at least one metric of decline. (B) The change in the log-odds of showing elevated extinction risk for species subject to each anthropogenic threat. Points to the right of the dashed vertical line (blue) indicate a significant positive association. Gray points indicate that confidence intervals overlap zero. Parameter estimates are coefficients of a binomial logistic regression model (with all other threats included), 95% confidence intervals (thin lines), and 90% confidence intervals (thick lines). (C) Associations between threats and decline in status (increasing extinction risk through time). (D) Associations between threats and a decreasing population trend.

