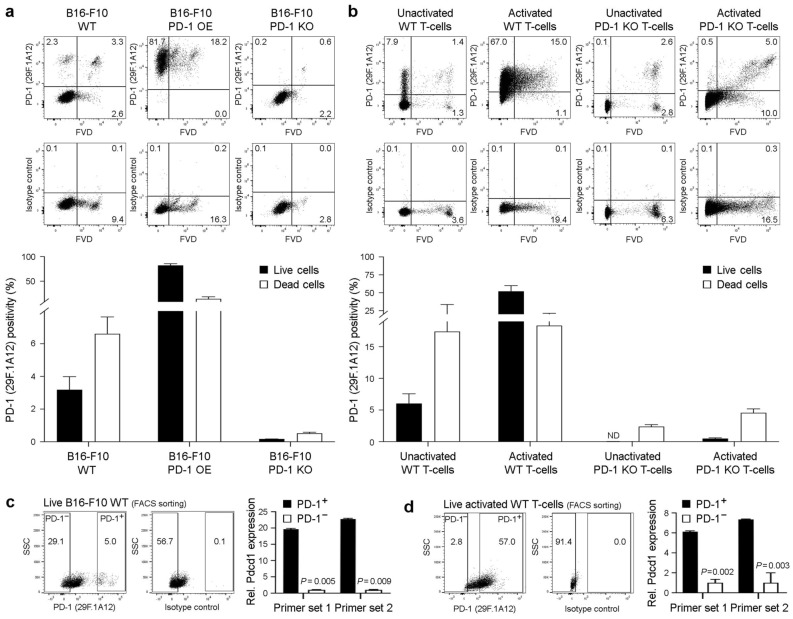
Figure 2.
The anti-PD-1 29F.1A12 monoclonal antibody recognizes PD-1 surface protein on live B16-F10 melanoma cells. (a,b) Representative FACS plots of surface PD-1 protein expression (clone 29F.1A12) or isotype control staining and % positivity (mean ± s.e.m.) on live versus dead (fixable viability dye, FVD-negative or -positive, respectively) (a) B16-F10 wild-type (WT), PD-1-overexpressing (OE), or PD-1 knockout (KO) melanoma cells, or on (b) unactivated versus activated WT or PD-1 KO T-cells (C57BL/6), respectively. (c,d) Relative Pdcd1 expression (mean ± s.d., two distinct primer sets), as determined by real-time qPCR (right), in FACS-sorted (29F.1A12, left) live (FVD−) (c) PD-1+ versus PD-1− B16-F10 WT melanoma cells or (d) respective activated WT (C57BL/6) T-cell subsets. All results are representative of at least n = 3 independent experiments. **p < 0.01; ND, not detected.

