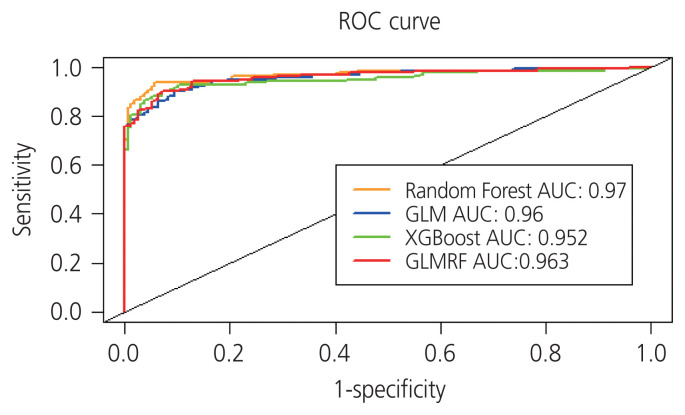
Fig. 2.
Two receiver operating characteristic (ROC) curves of 10-fold cross-validation for four classification methods for optimal biomarker sets. All four methods showed similar Random Forest performances. The X-axis represents the 1-specificity and the Y-axis represents sensitivity. The set of multiple biomarkers exhibited the highest performance in early diagnosis of ovarian cancer. AUC, area under the curve; GLM, general linear model; XGBoost, extreme gradient boosting; GLMRF, generalized linear model random forest.

