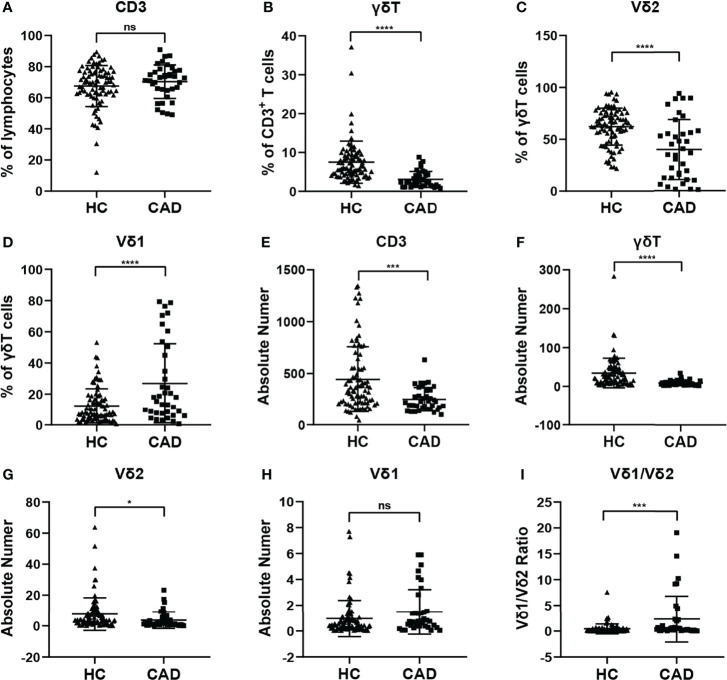
Figure 1.
Statistical comparison of the percentages and absolute numbers of γδ T cell and its subsets Vδ1+T cells, Vδ2+T cells, and Vδ1/Vδ2 ratios in the peripheral blood between healthy individuals (HC) and CAD patients. (A) CD3+T cells, (B) γδ T cells, (C) Vδ2+T and (D) Vδ1+T cells frequencies as percentages of lymphocytes, CD3+T cells, and total γδ T cells respectively, absolute numbers of (E) CD3+T cells, (F) γδ T cells, (G) Vδ2+T and (H) Vδ1+T cells and (I) Vδ1/Vδ2 ratios of healthy individuals versus CAD patients. *P < 0.05, ***P < 0.001, and ****P < 0.0001; ns, no significance.

