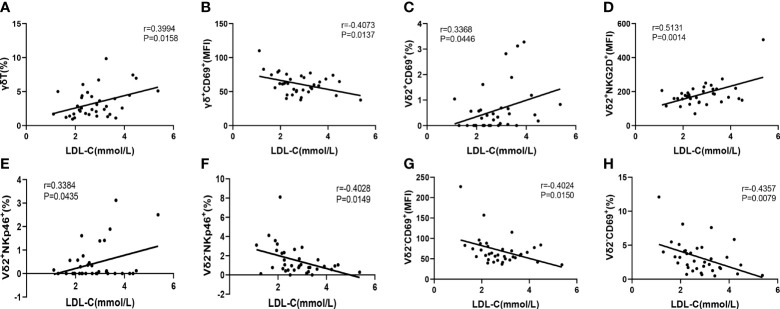
Figure 6.
The Pearson correlation between serum LDL-C level in CAD patients and immune cell phenotypes of γδ T cell and its subsets in peripheral blood of CAD patients. (A) γδ T cells, (B) γδ+CD69+T cells, (C) Vδ2+CD69+T cells, (D) Vδ2+NKG2D+T cells, (E) Vδ2+NKp46+T cells, (F) Vδ2-NKp46+T cells and (G, H) Vδ2-CD69+T cells.

