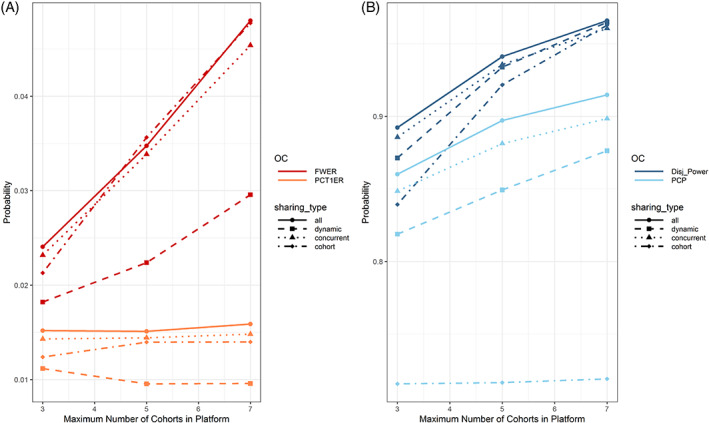
FIGURE 3.

Impact of the data sharing (linetype and point shape) and maximum number of cohorts per platform (x‐axis) on the per‐cohort and per‐platform type 1 error (Figure 3A) and power (Figure 3B) in treatment efficacy setting 1. Please note that different scaling of the y‐axis is used in the two subfigures. With increasing number of cohorts in the platform, the chance to make at least one correct positive or negative decision increases. When data is shared, the per‐cohort power increases, while it stays constant when no data sharing is planned
