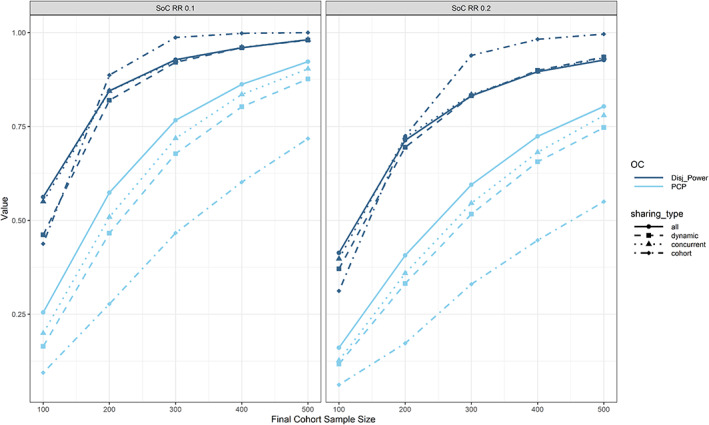
FIGURE 5.

Impact of SoC response rate (columns; treatment efficacy settings 7 vs. 14), final cohort sample size (x‐axis) and data sharing (linetypes and point shapes) on per‐cohort and per‐platform power. We observed consistently lower power for increased SoC response rate. We also observed that while for lower sample sizes the per‐platform power is increased with increasing amount of data sharing, this is not true anymore for larger sample sizes
