Figure 1.
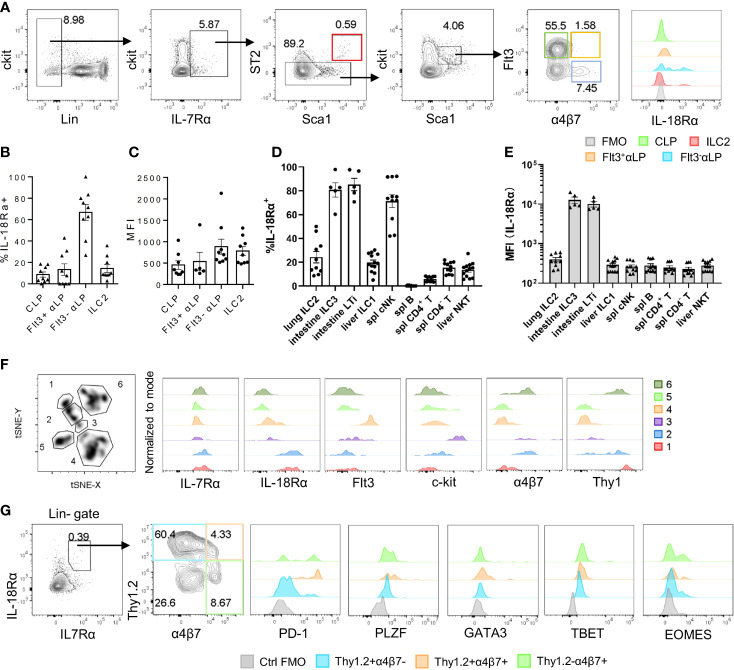
IL-18Rα is expressed on BM ILC progenitors. (A) The expression of IL-18Rα on BM progenitors of wild-type C57BL/6J mice was analyzed by flow cytometry. CLP, Flt3+αLP, Flt3-αLP, and ILC2 were defined as follows respectively: lin-IL-7Rα+ckitintSca1intST2-Flt3+α4β7-, lin-IL-7Rα+ckitintSca1intST2-Flt3+α4β7+, lin-IL-7Rα+ckitintSca1intST2-Flt3-α4β7+, lin-IL-7Rα+Sca1+ST2+. (B) Percentage of IL-18Rα+ cells in the progenitors in panel (A, C) Mean fluorescence intensity of IL-18Rα in IL-18Rα+ cells from CLP, Flt3+ αLP, Flt3- αLP, and ILC2 in panel (A)(D) Percentage of IL-18Rα+ lymphocytes in peripheral tissues. (E) Mean fluorescence intensity of IL-18Rα in lymphocytes in peripheral tissues. (F) t-SNE analysis of lin-IL-7Rα+ cells in the BM, and expression of IL-7Rα, IL-18Rα, Flt3, ckit, α4β7, and Thy1 in 6 clusters. (G) Representative FACS plot showing the expression of progenitor and ILC-related markers in Thy1+α4β7-, Thy1+α4β7+, and Thy1-α4β7+ in BM IL-7Rα+IL-18Rα+ cells. Data are representative of more than three independent experiments with three mice in each group in panels (B–E). The data are presented as mean ± SEM in panels (B–E). Data are representative of three mice in panel (G).

