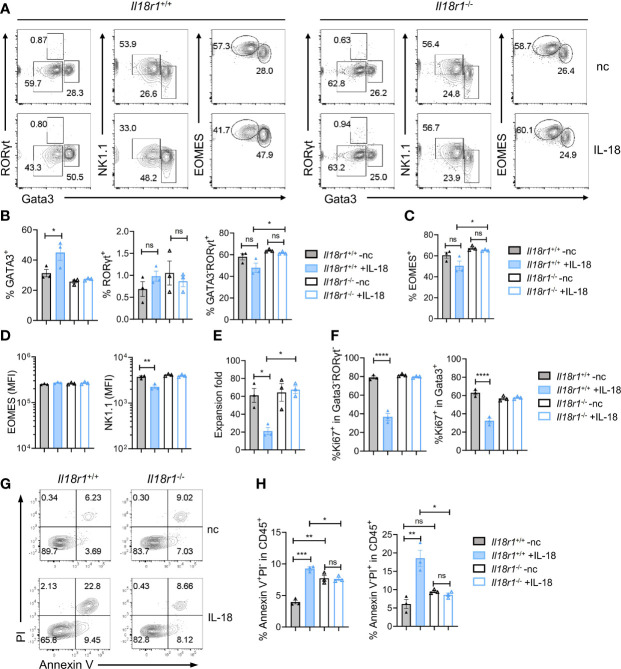
Figure 7.
IL-18 suppresses the growth of ILCP/ILCs. Lin-ST2-PD1+IL-18Rα+ cells (350~700 cells) were FACS-sorted from Il18r1+/+ and Il18r1-/- BM and cultured on OP9-DL1 in the presence of SCF (20 ng/ml) and IL-7 (20 ng/ml) with or without IL-18 for 7 days. (A) Representative FACS plot showing NK/ILC1, ILC2, and ILC3 generated from the culture. (B, C) Percentage of the NK/ILC1, ILC2, and ILC3 in CD45+ cells from the culture. (D) Mean fluorescence intensity of EOMES and NK1.1 in GATA3-RORγt- cells. (E) Expansion fold of the cultured cells. (F) Percentage of Ki67+ cells in the indicated cell populations. (G–I) Representative FACS plot and statistical analysis showing the percentage of Annexin V+PI- (H) and Annexin V+PI+ (I) cells in CD45+ cells from the culture. Data are representative of two independent experiments with three mice in each group. The data were presented as mean ± SEM, analyzed by two-tailed Student’s t-test. * p < 0.05; ** p < 0.01; *** p < 0.001; **** p < 0.0001.

