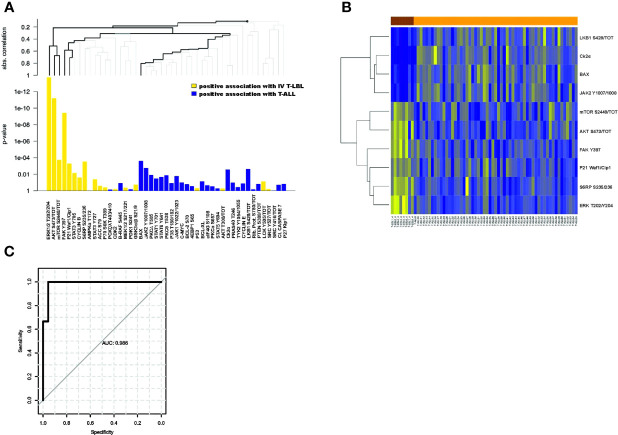
Figure 2.
Differentially expressed proteins between stage IV T-LBL and T-ALL samples. (A) Hierarchical clustering graph (HCG) of all proteins, where black bold lines highlight those proteins being significantly most strongly associated with stage IV T-LBL or T-ALL. Positive association with stage IV T-LBL (or T-ALL) refers to hyperactivated proteins in stage IV T-LBL (or in T-ALL). (B) Heatmap of the ten most differentially expressed proteins between stage IV T-LBL and T-ALL samples. (C) ROC curve of the predicted probabilities of being classified as a T-ALL or stage IV T-LBL for data in the testing set, together with the estimated area under the ROC curve (AUC).

