Figure 3.

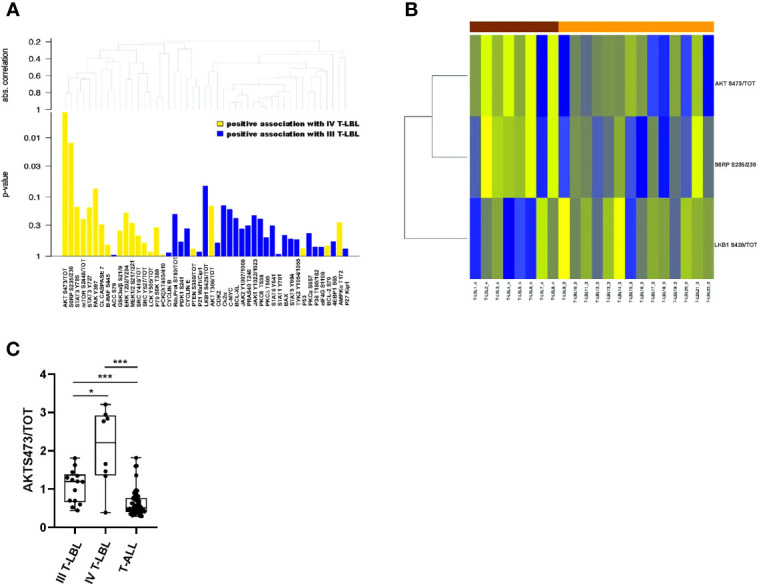
Differentially expressed proteins between stage IV and stage III T-LBL samples. (A) Hierarchical clustering graph (HCG) of all proteins, and a set of proteins being positively associated with stage IV or stage III T-LBL, with different intensities (height of columns is equal to p-values of single tests). Positive association with stage IV T-LBL (or T-ALL) refers to hyperactivated proteins in stage IV T-LBL (or in T-ALL). (B) Heatmap of the three significantly differentially expressed proteins between stage IV and stage III T-LBL samples (based on non-corrected p-values from single tests). (C) AKT S473/tot phosphorylation levels measured by RPPA analysis were significantly upregulated in stage IV T-LBL samples (n=8) compared to both T-ALL (n=57) and stage III T-LBL (n=14).*p < 0.05; ***p < 0.001.
