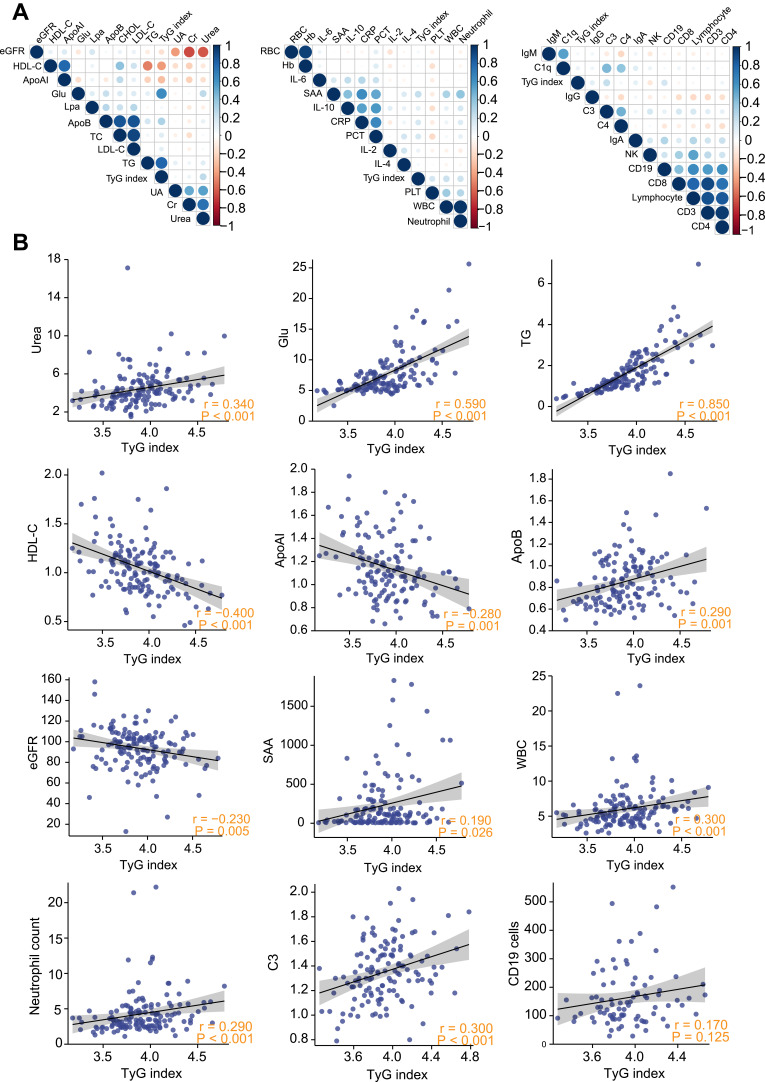
Figure 4.
Correlation of TyG index with lipoprotein, renal function, inflammatory indexes and immune indexes in non-re-positive and re-positive COVID-19 patients. (A) Heatmap of correlation between TyG index and lipoprotein, renal function, inflammatory indexes and immune indexes. (B) Correlation between 12 selected clinical indicators and TyG index.
Abbreviations: eGFR, estimated glomerular filtration rate; HDL-C, high-density lipoprotein cholesterol; ApoA1, apolipoprotein A1; Glu, glucose; Lpa, lipoprotein a; ApoB, apolipoprotein B; TC, total cholesterol; LDL-C, low-density lipoprotein cholesterol; TG, triglyceride; TyG index, triglyceride-glucose index; UA, uric acid; Crea, creatinine; Urea, urea nitrogen; RBC, red blood cell; Hb, hemoglobin; IL-6, interleukin-6; SAA, serum amyloid A; IL-10, interleukin-10; CRP, C-reactive protein; PCT, procalcitonin; IL-2, interleukin-2; IL-4, interleukin-4; PLT, platelet; WBC, white blood cell count; IgM, serum immunoglobulin M; C1q, complement C1q; IgG, serum immunoglobulin G; C3, complement C3; C4, complement C4; IgA, serum immunoglobulin A; NK, natural killer cell; CD19, cluster of differentiation 19; CD8,CD8+T cells; CD3,CD3+T cells; CD4,CD4+T cells.

