Figure 5.
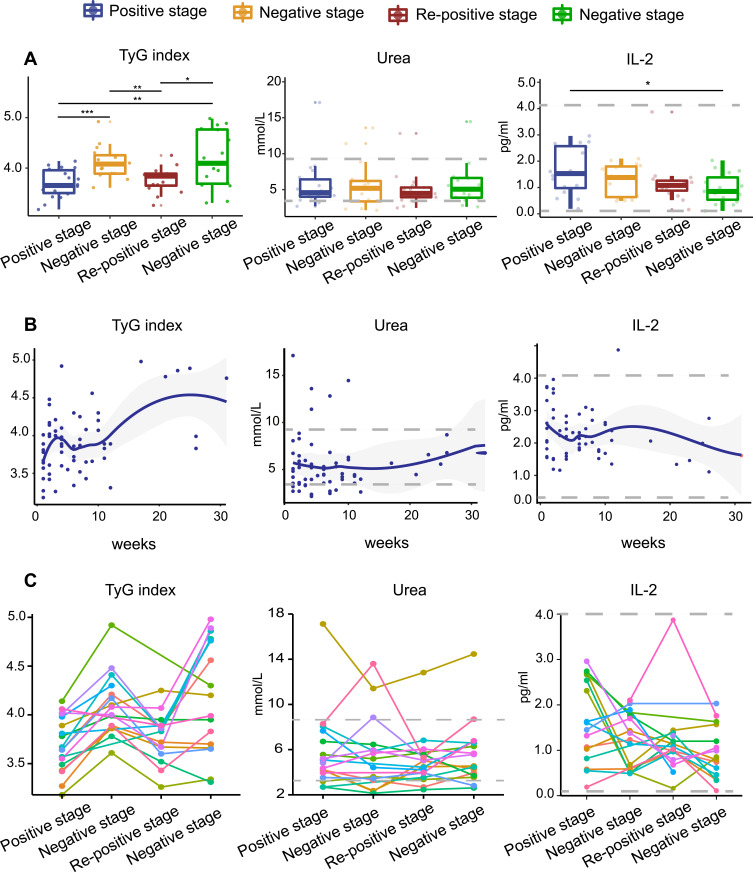
TyG index, Urea, and IL-2 in re-positive patients of COVID-19 at different stages. (A) TyG index, Urea, and IL-2 at different stages of the COVID-19 patients. The TyG index of the re-positive patients at positive and re-positive stage was lower than that of the negative stage, and the difference was statistically significant. The X-axis represents the stage of the patient’s course, which is segmented based on RT-PCR results, and the Y-axis is the value of the index. (B) Thirty-weeks temporal expressions of TyG index, Urea, and IL-2. The X-axis represents the time from onset to nucleic acid testing and the Y-axis is the value of the index. (C) Dynamic changes of TyG index, Urea, and IL-2 in re-positive patients of COVID-19 at different stages. The X-axis represents the stage of the patient’s course, which is segmented based on RT-PCR results, and the Y-axis is the value of the index.
Notes: *P value <0.05. **P value <0.01. ***P value <0.005.
Abbreviations: TyG index, triglyceride-glucose index; Urea, urea nitrogen; IL-2, interleukin-2.

