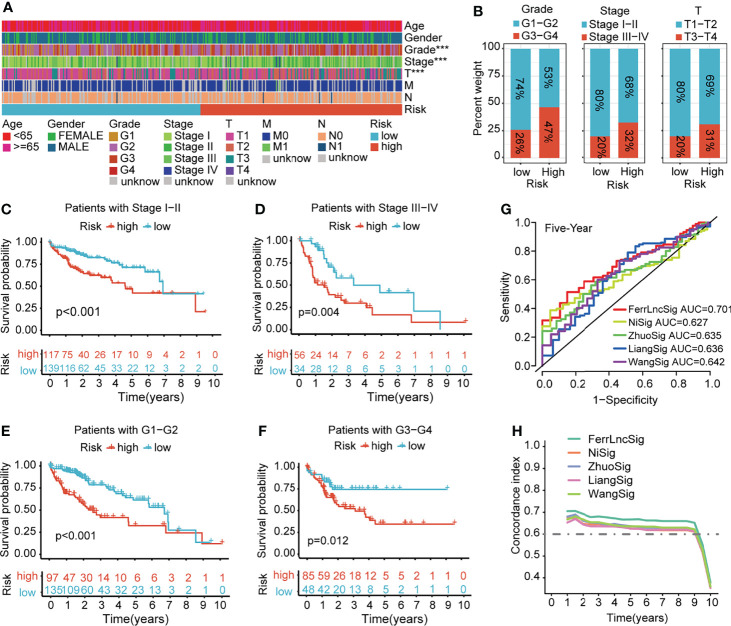
Figure 4.
Clinical relevance and model comparison. (A) Heatmap of correlations between prognostic signature and clinicopathological features. (B) Histograms showing the distribution of grade, stage, and T between the high- and low-risk groups. (C–F) Kaplan–Meier analyses of the signature stratified by stage and grade. (G) Multivariate ROC curves of different HCC signatures to predict the sensitivity and specificity of 5-year survival. (H) Time-dependent c-index curve analysis of different HCC signatures. ROC, receiver operating characteristic; HCC, hepatocellular carcinoma.

