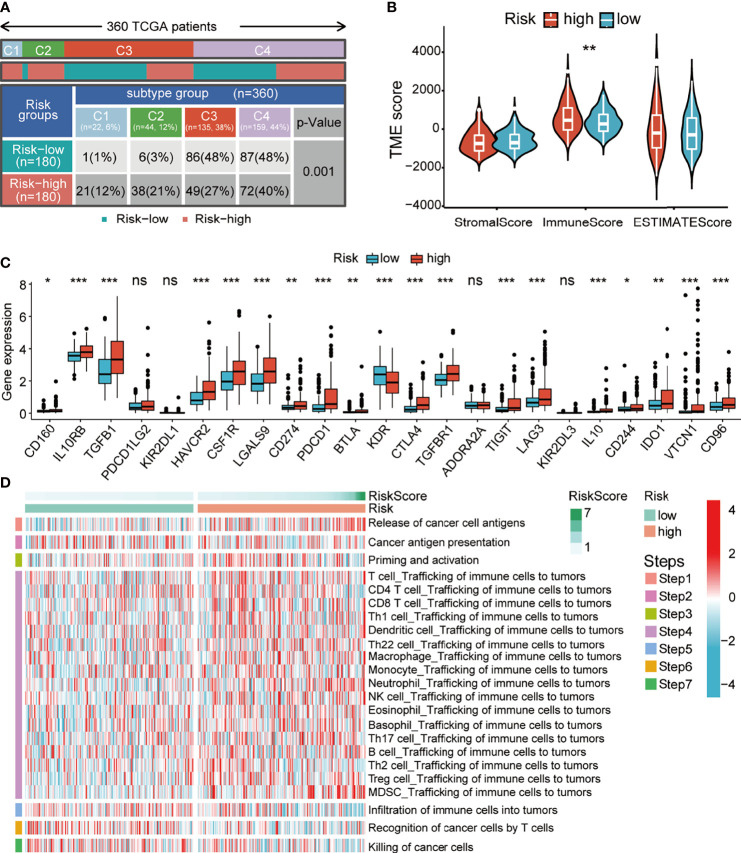
Figure 8.
Relationship between the risk score and altered immune landscape. (A) Table showing the distribution of HCC immune subtypes between different risk groups. (B) Violin plots showing the score differences of tumor microenvironment between the different risk groups. (C) Boxplots showing the differential expression of immune-suppressive checkpoints between the different risk groups. (D) Heatmap for anticancer immunity cycles pattern. HCC, hepatocellular carcinoma.

