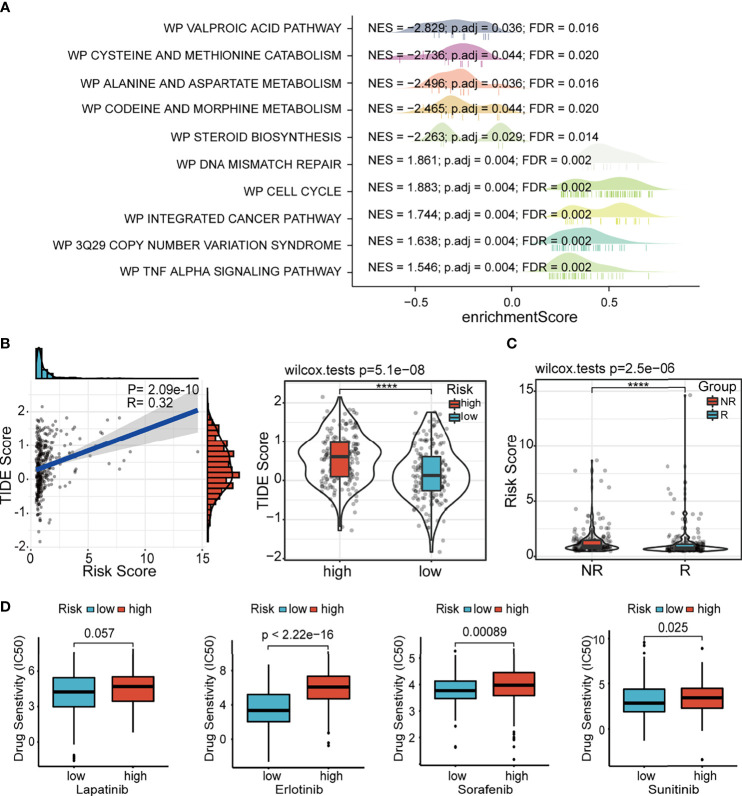
Figure 9.
GSEA and drug susceptibility analysis. (A) GSEA of ferroptosis-associated lncRNA signature based on WikiPathways database. (B) Correlation between the risk score and the TIDE score. (C) Correlation between the risk score and immune checkpoint blockade response. GSEA, gene set enrichment analysis; lncRNA, long non-coding RNA.

