Figure 1.
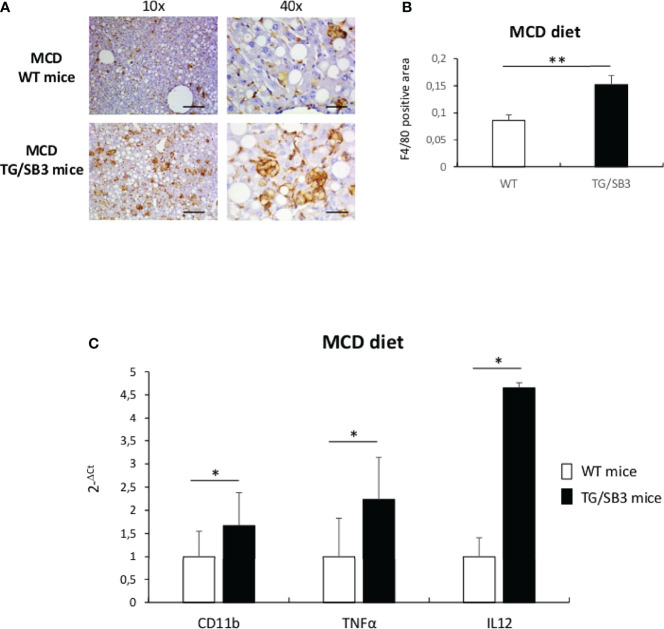
(A–C) (A) Immunoistochemistry analysis for F4/80 on liver specimens obtained from C57Bl6J WT mice and C57Bl6J transgenic mice for SB3 (TG/SB3) fed on MCD diet for 8 weeks. Magnification 10x, scale bar 200µm, magnification 40x, scale bar 50µm. (B) ImageJ software analysis performed to evaluate the amount of F4/80 positive area in C57Bl6J WT mice and C57Bl6J transgenic mice for SB3 (TG/SB3) fed on MCD diet for 8 weeks. **p < 0.01 versus WT mice. (C) Quantitative real time PCR analysis of CD11b, TNFα and IL12 in C57Bl6J WT mice and transgenic mice for SB3 (TG/SB3) fed on MCD diet for 8 weeks. *p < 0.05 versus WT mice.

