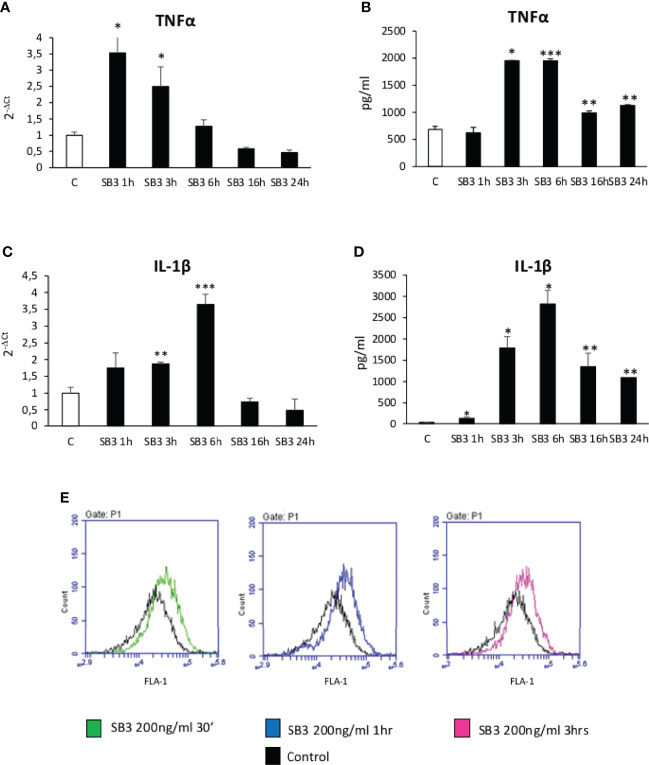
Figure 4.
(A–E) Time course analysis of transcript levels by quantitative real time PCR (A, C) as well as of protein levels by ELISA (B, D) of TNFα and IL-1β in human differentiated THP1 cells exposed or not to hrSB3 200ng/ml (SB3) up to 24 hours. *p < 0.05, **p < 0.01, ***p < 0.001 versus control cells. (E) DCFH-DA fluorescence in flow cytometry analysis to detect intracellular generation of reactive oxygen species induced by exposure of cells to hrSB3 200ng/ml for the indicated time points.

