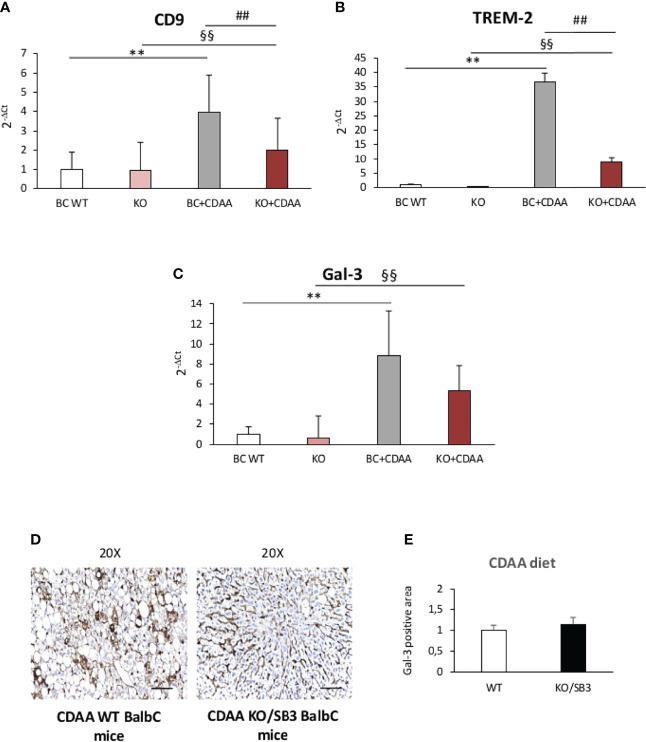
Figure 7.
(A–E) Quantitative real time PCR analysis of CD9, (A) TREM-2 (B) and Gal-3 (C) in control BalbC mice and knock out mice for SB3 fed on control diet (BC WT and KO) or CDAA diet for 12 weeks (BC+CDAA and KO+CDAA). **p < 0.01 versus BalbC control mice fed with control diet (BC WT); §§p < 0.01 versus BalbC control mice fed with control diet (KO), ##p < 0.01 versus BalbC control mice fed with CDAA diet (BC+CDAA). (D) Immunohistochemistry analysis for Gal-3 in liver specimens obtained from WT BalbC mice and KO/SB3 BalbC mice fed on CDAA diet for 12 weeks. Magnification 20x, scale bar 100µm. (E) ImageJ software analysis was performed to evaluate the amount of Gal-3 positive area in BalbC WT mice and knock out mice for SB3 (KO/SB3) fed on CDAA for 12 weeks.

