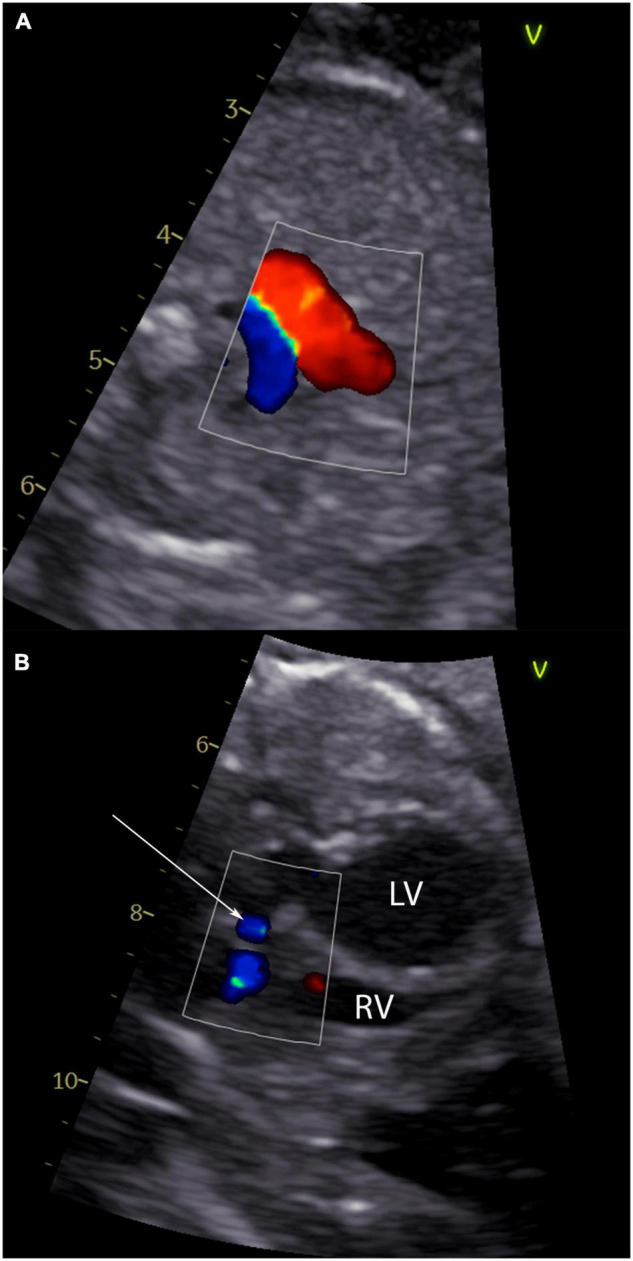
FIGURE 2.

Echocardiographic signs of an evolving hypoplastic left heart syndrome. Panel (A) shows a 3-vessel view of a fetus with critical aortic stenosis with antegrade flow in the ductus arteriosus Botalli (red flow) and retrograde flow in the aortic arch (blue flow). In panel (B) left to right shunting at the atrial level of the same fetus is shown (arrow).
