
FIGURE 3.
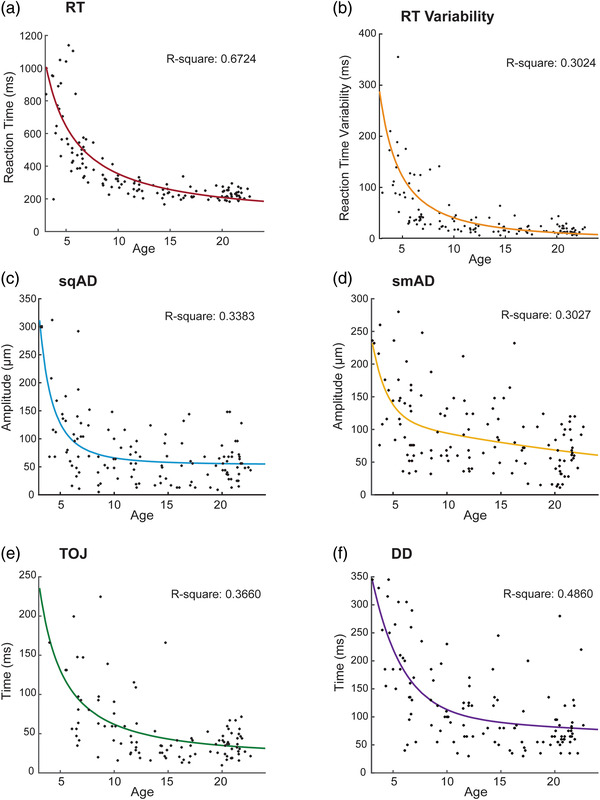
Exponential and power age effects in tactile processing from early childhood to adulthood. Nonlinear models were fit for each task as a function of age. Data points represent individual participants and curves represent best model fits. (a) Reaction time (ms) using a power fit. (b) Reaction time variability (ms) using a power fit. (c) Sequential amplitude discrimination (μm) using a power fit. (d) Simultaneous amplitude discrimination (μm) using an exponential fit. (e) Temporal order judgment (ms) using a power fit. (f) Duration discrimination (ms) using an exponential fit.