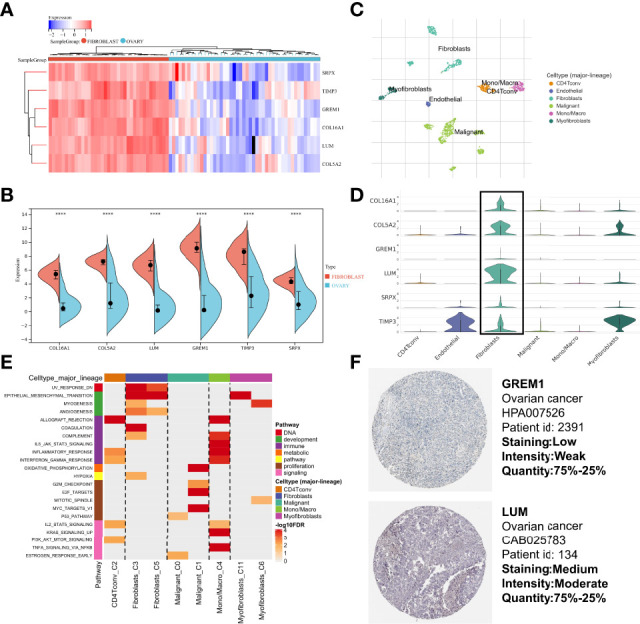
Figure 10.

Multidimensional expression validation. (A) Heatmap of gene expression in different cell lines based on “limma” package. (B) Wilcoxon test of gene expression in different cell lines. (C) Major cell type in single-cell seq. (D) Differential distribution of gene expression at the single-cell level. (E) GSEA of upregulated genes in different cell types. (F) IHC images of OC tissues from the HPA database. GSEA, Gene Set Enrichment Analysis; OC, Ovarian cancer; IHC, Immunohistochemistry; HPA, Human Protein Atlas.
