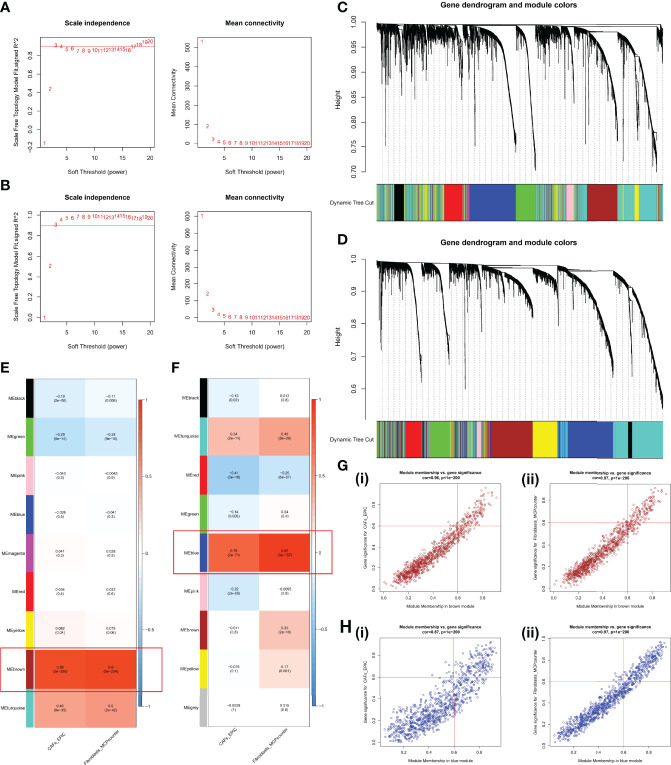
Figure 3.
WGCNA in the GPL570 meta-cohort and TCGA-OV cohort. (A) Scale independence and mean connectivity in the GPL570 meta-cohort. (B) Scale independence and mean connectivity in TCGA-OV cohort. (C) Gene dendrogram and modules before merging in the GPL570 meta-cohort. (D) Gene dendrogram and modules before merging in TCGA-OV cohort. (E) Pearson correlation analysis of merged modules and CAF score in the GPL570 meta-cohort. (F) Pearson correlation analysis of merged modules and CAF score in TCGA-OV cohort. (G) Scatterplot of MM and GS from the brown module in the GPL570 meta-cohort, including CAFs_EPIC (i) and Fibroblasts_MCPcounter (ii). (H) Scatterplot of MM and GS from the blue module in TCGA-OV cohort, including CAFs_EPIC (i) and Fibroblasts_MCPcounter (ii). WGCNA, Weighted Gene Co-expression Network Analysis; CAFs, Cancer-Associated Fibroblasts; GS, Gene Significance; MM, Module Membership.

