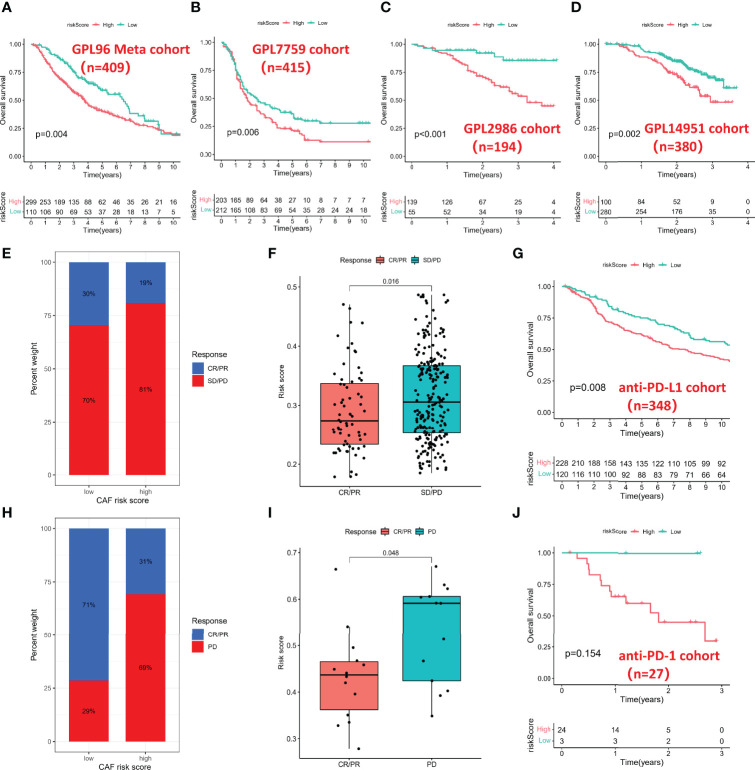
Figure 6.
Multidimensional validation for risk score. (A) Kaplan–Meier analysis in the GPL96 meta-cohort. (B) Kaplan–Meier analysis in the GPL7759 cohort. (C) Kaplan–Meier analysis in the GPL2986 cohort. (D) Kaplan–Meier analysis in the GPL14951 cohort. (E) Histogram of anti-PD-L1 response distribution in different risk groups. (F) Box plot of risk score in different anti-PD-L1 response groups. (G) Kaplan–Meier analysis in the anti-PD-L1 cohort. (H) Histogram of anti-PD-1 response distribution in different risk groups. (I) Box plot of risk score in different anti-PD-1 response groups. (J) Kaplan–Meier analysis in the anti-PD-1 cohort. PD-1, Programmed Death-1; PD-L1, Programmed Cell Death 1 Ligand.

