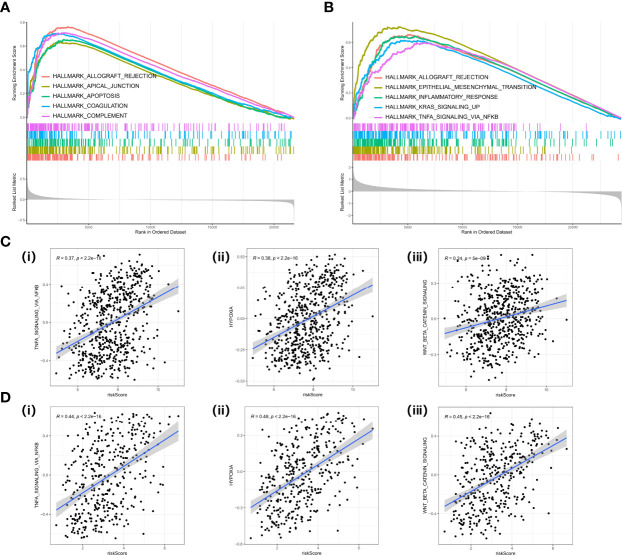
Figure 8.
GSEA in cancer hallmark gene set. (A) GSEA plot in the GPL570 meta-cohort. (B) GSEA plot in TCGA-OV cohort. (C) Correlation analysis between risk score and TNF signaling (i), hypoxia (ii), EMT (iii) in the GPL570 meta-cohort. (D) Correlation analysis between risk score and TNF signaling (i), hypoxia (ii), and EMT (iii) in TCGA-OV cohort. GSEA, Gene Set Enrichment Analysis; TNF, Tumor Necrosis Factor; EMT, Epithelial to Mesenchymal Transition.

