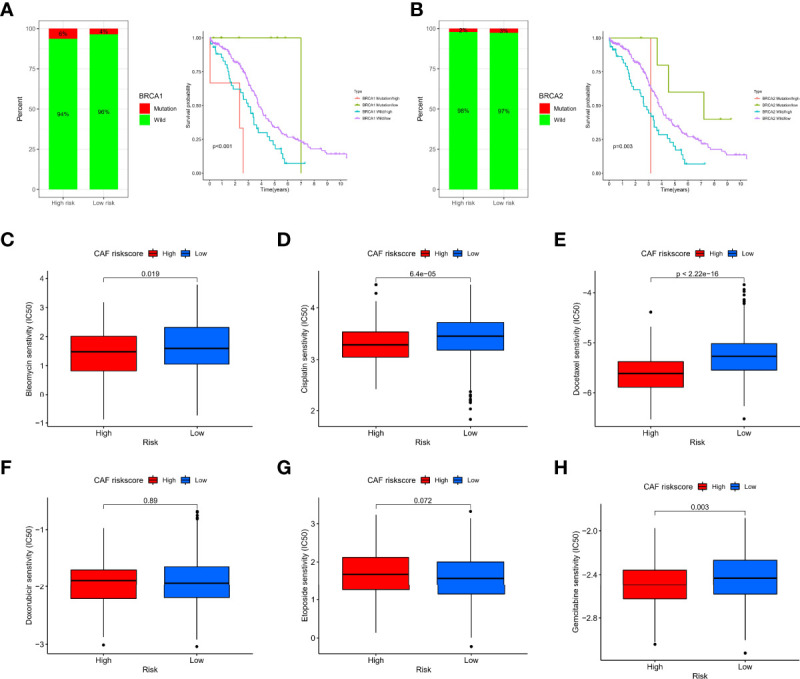
Figure 9.

Sensitivity of chemotherapy between different risk groups. (A) Histogram of BRCA1 state distribution and Kaplan–Meier analysis of integrated groupings. (B) Histogram of BRCA2 state distribution and Kaplan–Meier analysis of integrated groupings. IC50 values between different risk groups, including bleomycin (C), cisplatin (D), docetaxel (E), doxorubicin (F), etoposide (G), and gemcitabine (H).
