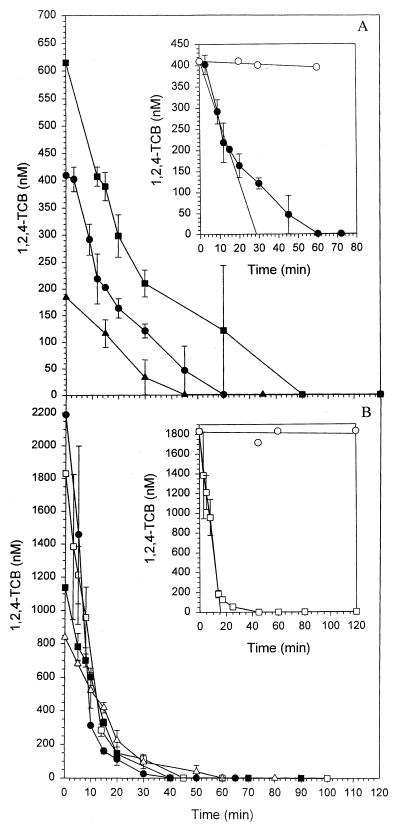
FIG. 1.
Degradation of 1,2,4-TCB at initial concentrations between 184 and 2,190 nM by Burkholderia sp. strain PS14 at a cell concentration of 6.7 mg (dry weight) per liter. (A) Initial 1,2,4-TCB concentrations of 185 nM (▴), 410 nM (●), and 615 nM (■). (B) Initial 1,2,4-TCB concentrations of 840 nM (▵), 1,138 nM (■), 1,830 nM (□), and 2,190 nM (●). (Insets) Degradation of 1,2,4-TCB at initial concentrations of 410 nM (A) and 1,830 nM (B). Regression through the linear ranges of the curves gives the initial transformation rates. Open circles represent sterile controls. Values are the means of two to four independent experiments, and regressions were carried out with these means. Error bars show standard deviations.

