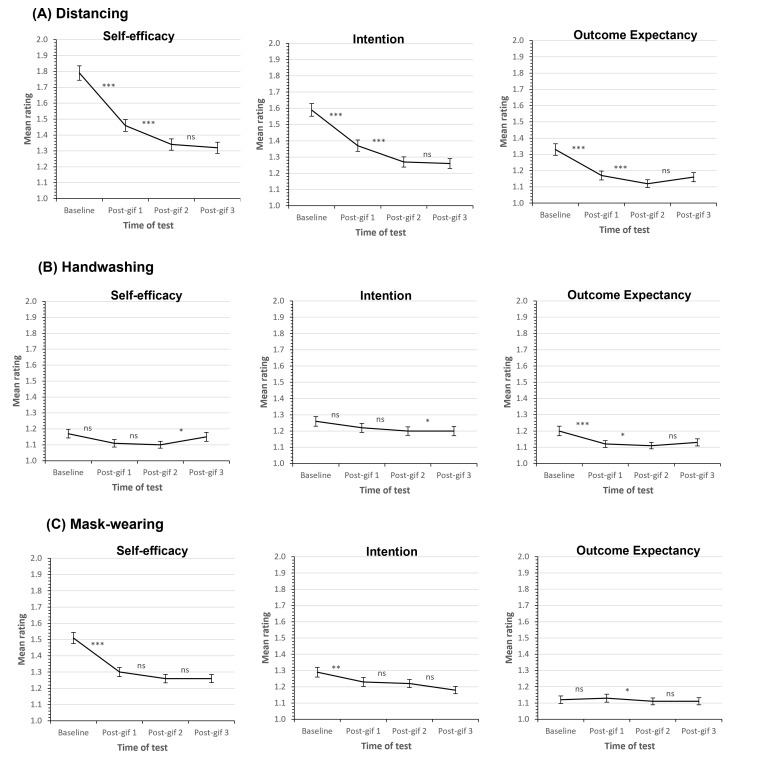
Figure 2.
Intentions and beliefs in relation to the behaviours. Line graphs show mean self-efficacy, intention, and outcome expectancy Likert scale ratings in the pre- and post-GIF exposure phases for (A) distancing, (B) handwashing and (C) mask-wearing. In all cases, lower ratings reflect stronger intentions and beliefs. Error bars show the standard error of the mean. Significance values from pairwise comparisons (baseline vs post-GIF1, post-GIF1 vs post-GIF2, and post-GIF2 vs post-GIF3) are shown, where ns = non-significant, * = P < 0.05, ** = P < 0.01, and *** = P < 0.001. Panel A. Distancing; Panel B. Handwashing; Panel C. Mask-wearing.

