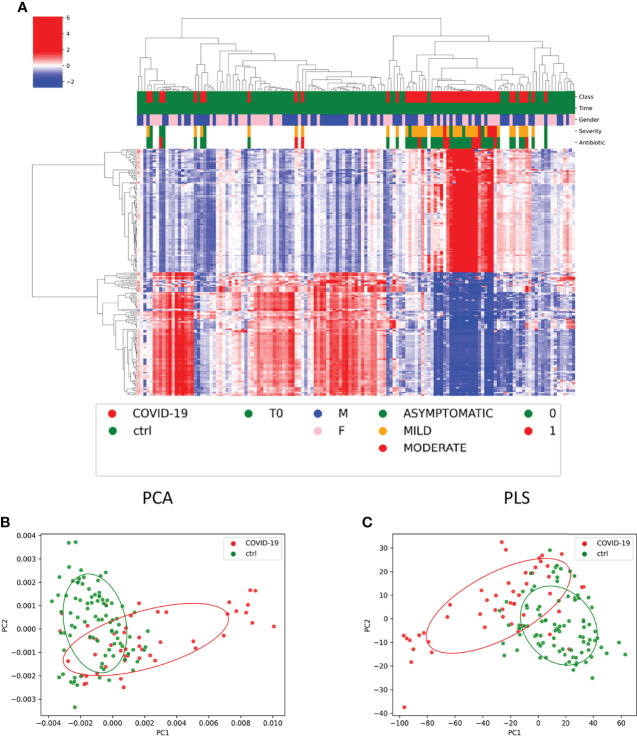
Figure 7.
Functional profile of microbial communities of COVID-19 and CTRL subgroups. (A) Graphical representation of hierarchical analysis of the KO-based prediction of functional profile of microbial communities of COVID-19 and CTRL subgroups. The top 200 features with lowest p-value (p < 0.05). The color scale characterizes the Z- score for each variable: red, high level; blue, low level. The column color labels represent respectively: patient’s class (red, COVID-19; green, CTRLs), time (green, T0), gender (blue, male; pink, female), severity (green, asymptomatic; orange, mild; red, moderate), and antibiotic [green, absent (0); red, present (1)]. (B, C) Principal component analysis (PCA) and partial least-squares regression (PLS) interpretable visualizations, based on of KO feature projection for COVID-19 and CTRLs.

