Figure 1.
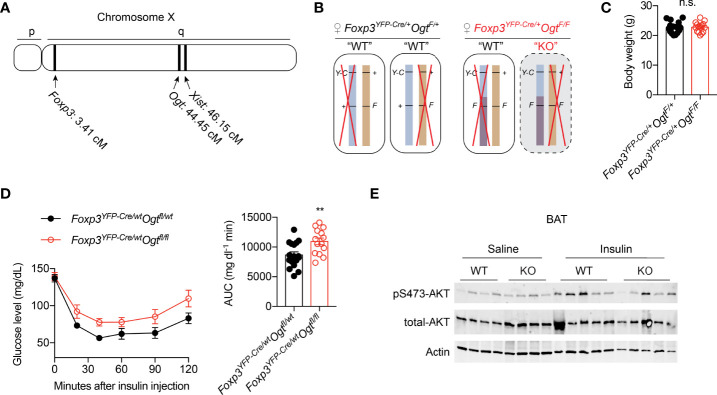
Mosaic OGT-deficiency in Treg cells decreases insulin sensitivity. (A) Chromosome positions of mouse Foxp3 and Ogt genes. The Xist gene is shown for reference. cM, centimorgan. (B) Schematic view of allele combinations of the Foxp3 and Ogt genes in Foxp3YFP-Cre/wtOgtF/+ and Foxp3YFP-Cre/wtOgtF/F female mice. Y-C, YFP-Cre; F, floxed; +, wildtype (wt). Red “X” indicates random inactivation of one of the two X chromosomes. (C) Body weight of 3-month-old, NC-fed Foxp3YFP-Cre/wtOgtF/+ (n = 18) and Foxp3YFP-Cre/wtOgtF/F (n = 15) female mice. (D) Insulin tolerance test of 3-month-old, NC-fed Foxp3YFP-Cre/wtOgtF/+ (n = 17) and Foxp3YFP-Cre/wtOgtF/F (n = 14) female mice. Area under curve (AUC) is shown to the right. (E) pS473-Akt and total-Akt immunoblotting of BAT protein lysates from Foxp3YFP-Cre/wtOgtF/+ and Foxp3YFP-Cre/wtOgtF/F female mice treated with saline or insulin for 30 min. Data are presented as mean ± SEM. n.s., not significant; **, p < 0.01 by unpaired student’s t-test.

