Figure 4.
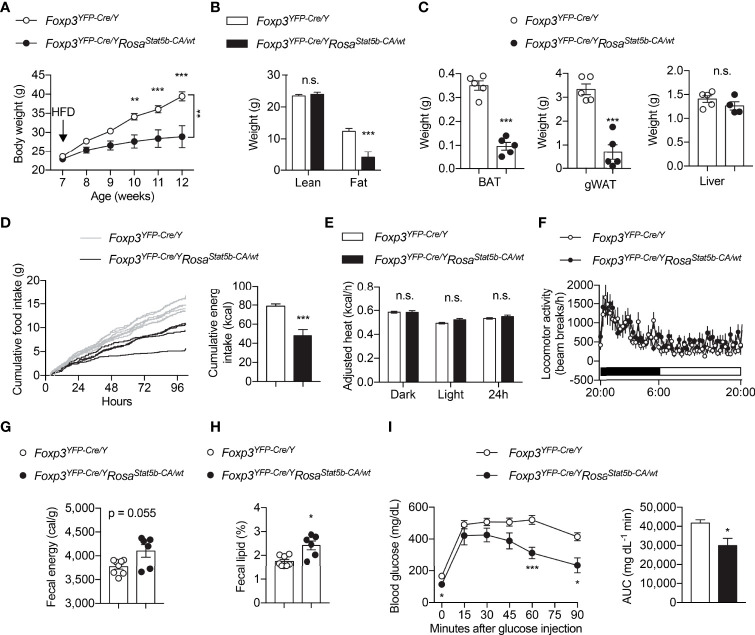
Protection of Foxp3YFP-Cre/YRosa26Stat5b-CA/wt mice from diet-induced obesity. (A) Body weight of Foxp3YFP-Cre/Y (n = 9) and Foxp3YFP-Cre/YRosa26Stat5b-CA/wt (n = 6) mice after HFD feeding. (B) Lean and fat mass of HFD-fed Foxp3YFP-Cre/Y (n = 9) and Foxp3YFP-Cre/YRosa26Stat5b-CA/wt (n = 6) mice. (C) Weight of BAT, gonadal WAT, and liver of HFD-fed Foxp3YFP-Cre/Y (n = 5) and Foxp3YFP-Cre/YRosa26Stat5b-CA/wt (n = 5) mice. (D) Cumulative food intake of Foxp3YFP-Cre/Y (n = 7) and Foxp3YFP-Cre/YRosa26Stat5b-CA/wt (n = 4) mice when switched to HFD feeding. (E) Body weight-adjusted heat production and (F) locomotor activity of HFD-fed Foxp3YFP-Cre/Y (n = 11) and Foxp3YFP-Cre/YRosa26Stat5b-CA/wt (n = 6) mice, determined by metabolic cages. (G) Fecal energy and (H) fecal lipid percentage of HFD-fed Foxp3YFP-Cre/Y (n = 8) and Foxp3YFP-Cre/YRosa26Stat5b-CA/wt (n = 6) mice. (I) Glucose tolerance test of HFD-fed Foxp3YFP-Cre/Y (n = 9) and Foxp3YFP-Cre/YRosa26Stat5b-CA/wt (n = 6) mice. Area under curve (AUC) is shown to the right. Data are presented as mean ± SEM. n.s., not significant; *, p < 0.05; **, p < 0.01; ***, p < 0.001 by unpaired student’s t-test or two-way ANOVA (A, I).

