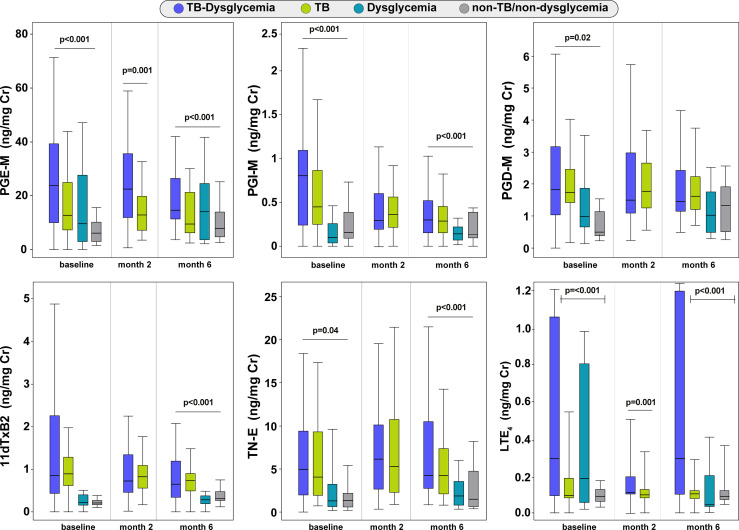
Figure 1.
Comparison of the distribution of urinary eicosanoids between the study groups. Box plot depicting the distribution of eicosanoids (median and interquartile range) among TB-dysglycemia, TB, dysglycemic patients and non-TB/non-dysglycemia individuals at each timepoint. Groups were compared using Kruskal Wallis (for four groups) and Mann Whitney tests (for two groups). Individuals without TB (Dysglycemia and non-TB/non-dysglycemia groups) had only two visits (baseline and month 6). TB, tuberculosis; PGE-M, major urinary PGE2 metabolite; PGD-M, major urinary PGD2 metabolite; PGI-M, 2,3-dinor-6-keto-PGF1α (PGI2 Metabolite); 11dTxB2, 11-dehydro-thromboxane B2 (TxB2 urinary metabolite); TN-E, tetranor-PGE1 (urinary PGE2 metabolite); LTE4, Leukotriene E4.

