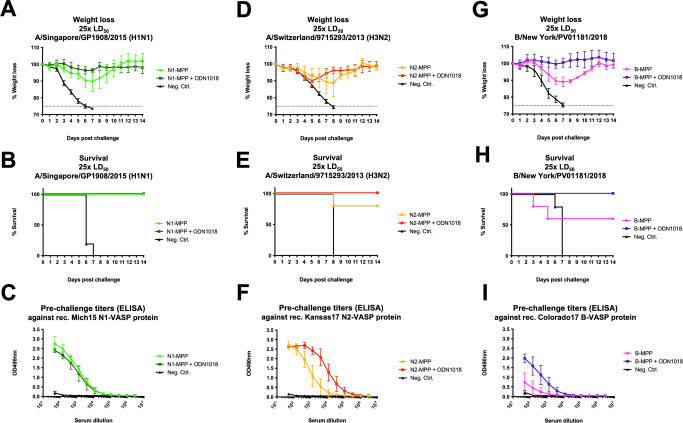
Fig. 7. Testing the protective potential of N2-MPP and B-NA-MPP in vivo.
Female 6–8 week old BALB/c (A–C, G–I) or DBA.2 (D–F) mice (n = 5 per group) were vaccinated in a prime/boost regimen with the respective recombinant protein. Blood was obtained 42 days after the prime and used for serological analysis. A Weight loss curve and B survival curve after challenge with 25xmLD50 of A/Singapore/GP1908/15 H1N1 (IVR-180). Differences in survival were analyzed using a Mantel–Cox log-rank test. N1-MPP vs Neg. Contr. p = 0.0035; N1-MPP + ODN1018 vs Neg. Contr. p = 0.0035; other differences were not statistically significant (p > 0.05). C ELISA against rec. Mich15 N1-VASP protein. D Weight loss curve and E survival curve after challenge with 25xmLD50 of A/Switzerland/9715293/13 (H3N2, mouse adapted). Differences in survival were analyzed using a Mantel–Cox log-rank test. N2-MPP vs Neg. Contr. p = 0.0143; N2-MPP + ODN1018 vs Neg. Contr. p = 0.0027; other differences were not statistically significant (p > 0.05). F ELISA against recombinant N2-VASP protein. G Weight loss and H survival after challenge with 25xmLD50 of B/New York/PV01181/18. Differences in survival were analyzed using a Mantel–Cox log-rank test. B-MPP + ODN1018 vs Neg. Contr. p = 0.0035; other differences were not statistically significant (p > 0.05). I ELISA was performed using serum samples against the rec. B-NA-VASP protein. A, C, D, F, G and I: shown is mean plus standard deviation.

