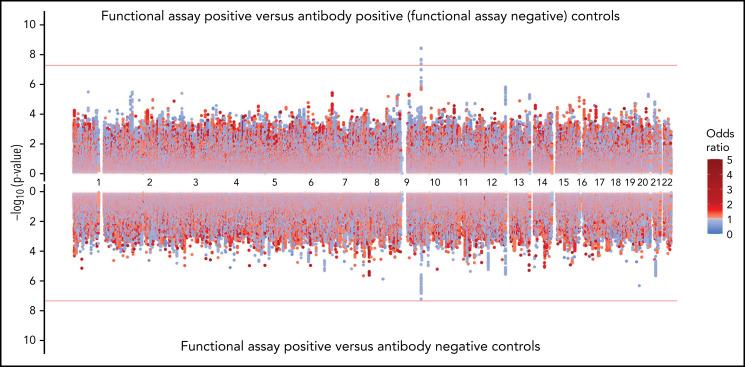
Figure 3.
Genome-wide association results for positive functional assay status vs patients with positive antibodies (above) and vs patients with negative antibodies (below) from the meta-analysis of discovery and replication cohorts. P values were generated using random-effects meta-analysis logistic regression adjusted for age, sex, and principal components 1-3 in an additive model. P values on the −log10 scale are plotted on the left vertical axis, and the chromosomal position is plotted along the horizontal axis. The significance threshold of 5 × 10⁻⁸ is indicated by the red horizontal lines. ORs are indicated by dot color as described in the legend on the right.

