
Fig. 2.
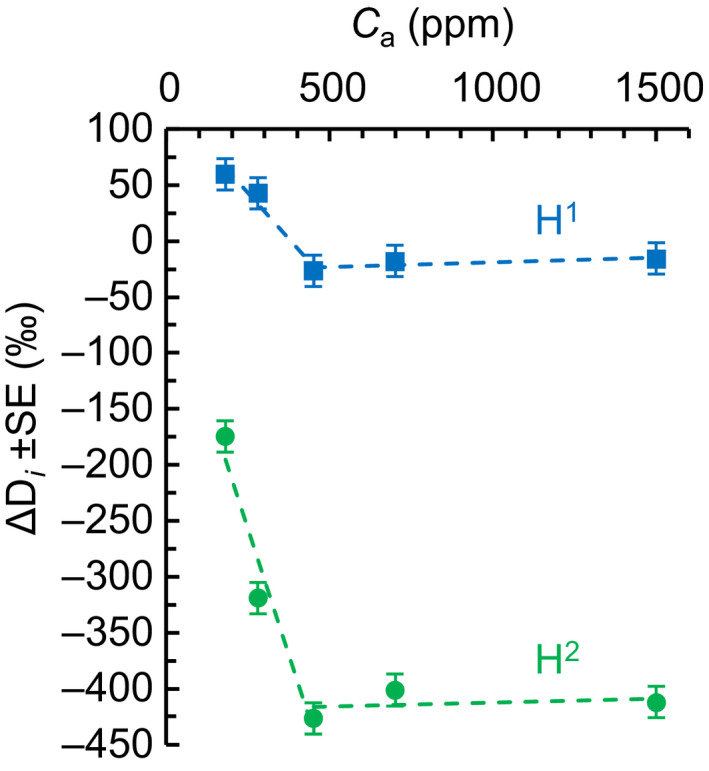
Relative deuterium (D) abundance at H1 (blue squares), and H2 (green circles) of Helianthus annuus leaf starch. Plants were grown in chambers at ambient CO2 concentration (C a) = 450 ppm. After a day in darkness to drain starch reserves, plants were grown at different levels of C a (180, 280, 450, 700, and 1500 ppm) corresponding to different levels of intercellular CO2 concentration (C i) (140, 206, 328, 531, and 1365 ppm) for 2 d. Data expressed in terms of the molecular average as ΔD i = D i /(ΣD i /7) − 1, where D i denotes relative D abundances at specific glucose hydrogen positions (±SE = 14.1‰). Figure shows discrete data. Dashed lines added to guide the eye.