
FIGURE 6.
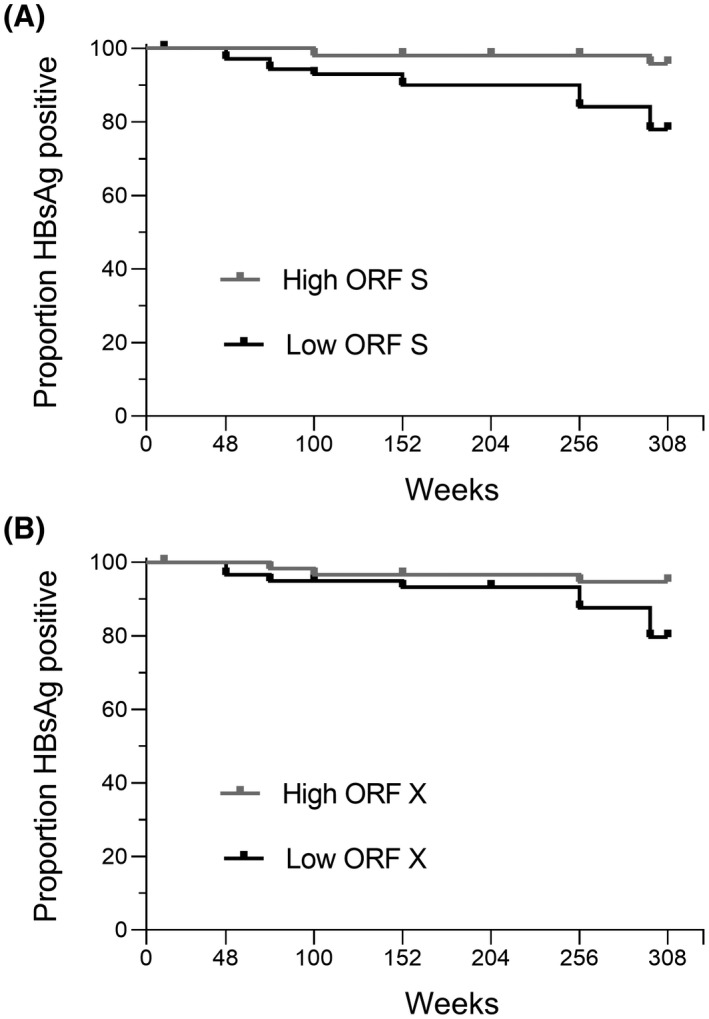
Kaplan‐Meier curve of HBsAg‐loss events over time. Proportion of patients who were HBsAg positive shown over time for 50% patients with the highest or lowest levels of integrated HBV containing ORF S (A) or ORF X (B)
Official websites use .gov
A
.gov website belongs to an official
government organization in the United States.
Secure .gov websites use HTTPS
A lock (
) or https:// means you've safely
connected to the .gov website. Share sensitive
information only on official, secure websites.
Kaplan‐Meier curve of HBsAg‐loss events over time. Proportion of patients who were HBsAg positive shown over time for 50% patients with the highest or lowest levels of integrated HBV containing ORF S (A) or ORF X (B)