
FIGURE 4.
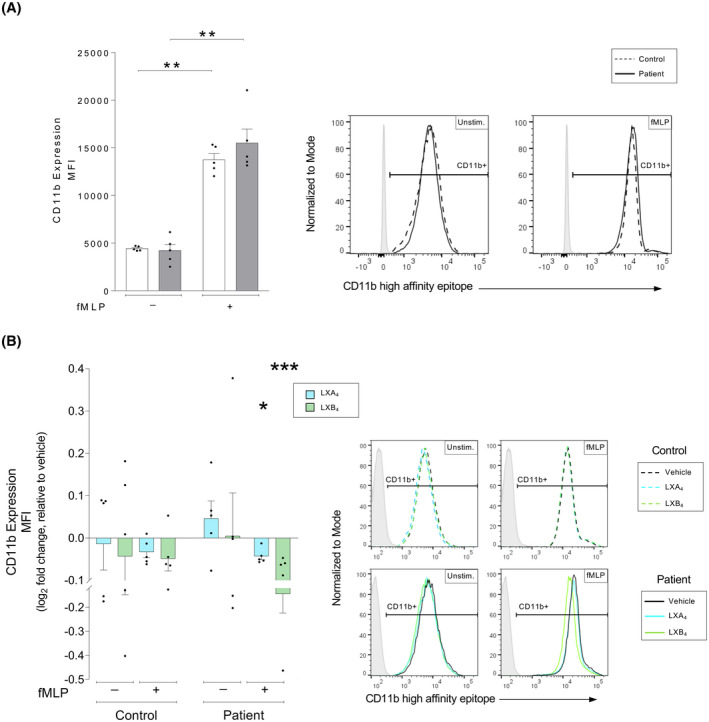
Lipoxin‐mediated changes to the high‐affinity conformation of the CD11b receptor in human neutrophils from patients with atherosclerosis versus healthy controls. Whole blood from healthy controls (n = 5) or patients with atherosclerosis (n = 5) was exposed to inflammatory stimulus as indicated, either in the absence or presence of lipoxin A4 (LXA4: 500 nM) or lipoxin B4 (LXB4: 500 nM). Neutrophil expression of the CD11b high‐affinity conformation was measured by flow cytometry. (A) Neutrophil expression of the CD11b high‐affinity conformation was measured as the cellular mean fluorescence intensity (MFI). The expression was measured in controls (white bars) and patients (gray bars). The cells were untreated (Unstim.) or stimulated with chemotactic peptide N‐formyl‐Met‐Leu‐Phe (fMLP, 0.4 μM). Representative MFI histograms for CD11b expression and respective conditions are shown for controls (dashed line) and patients (solid line), where the gates were determined using a negative population (gray shaded peaks). (B) LXA4 (blue bars) and LXB4 (green greens)‐induced changes to the neutrophil expression of the CD11b high‐affinity conformation was calculated as the log2 fold change relative to respective vehicle‐treated condition. The samples were stimulated as indicated. The bar graphs show levels of cellular CD11b MFI. Representative histograms for the expression of CD11b and respective conditions are shown for vehicle (black line), LXA4 (blue line), and LXB4 (green line), where the gates were determined using a negative population (gray shaded peaks). Assuming non‐Gaussian distribution of the human samples, statistical analysis was determined using Mann–Whitney U test when comparing two groups, and Kruskal–Wallis test with Dunn's post hoc comparisons when comparing more than two groups. Data are presented as mean ± standard error of the mean (SEM). Statistical significance is indicated as *p < .05, **p < .01, ***p < .001