
FIGURE 3.
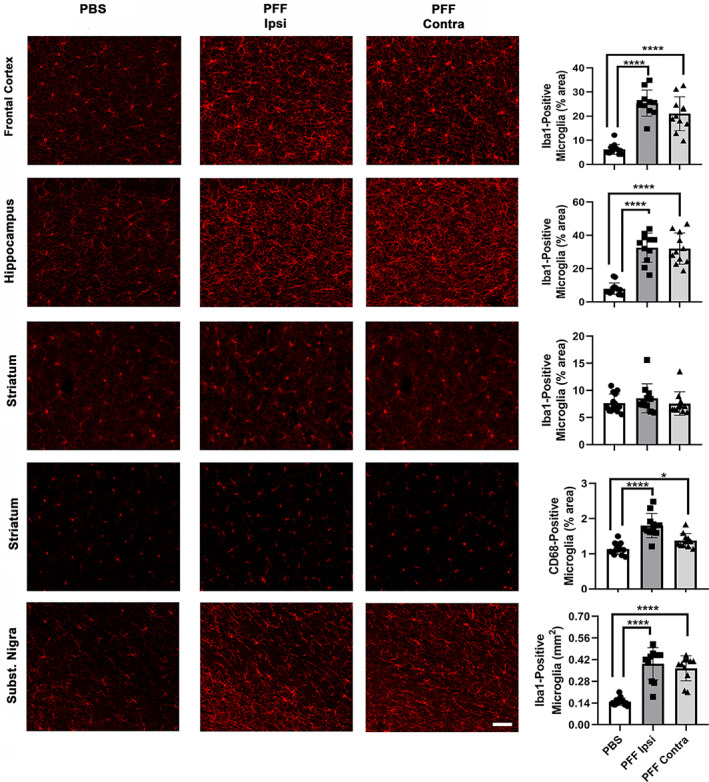
Striatal injection of murine α‐syn PFFs induced widespread microgliosis in different brain regions. Mice were euthanized 90 dpi. Panels show microgliosis measured on Iba1‐stained sections of frontal cortex (upper row), hippocampus (second row), striatum (third row), and Subst. Nigra (last row), and on CD68‐stained sections of striatum (4th row). A very strong microgliosis (up to 4× over control) was observed bilaterally in frontal cortex, hippocampus, and SN. No increase in Iba1 signal, but a significant bilateral increase in CD68 signal was observed in the striatum of PFF‐injected mice. For group comparisons and graphing, ipsilateral PBS measures were combined contralateral PBS measures, since they were similar. Pictures show the ipsilateral side of PBS‐injected mice. ****p < .0001, *p < .05, compared to PBS controls by Dunnett's post hoc; n = 10–11/group; graphs are mixed scattergrams/bar diagrams, where points represent the individual values for each animal, and bars represent the means +/− SD; 95% confidence intervals of differences: Frontal cortex – PBS versus PFF ipsi: −23.9 to −14.5, PBS versus PFF contra: −19.5 to −10.1; hippocampus: – PBS versus PFF ipsi: −31.5 to −17.7, PBS versus PFF contra −31.0 to −17.2; striatum (Iba1) – PBS versus PFF ipsi: −2..9 to 1.1, PBS versus PFF contra: −1.9 to 2.1; striatum (CD68) – PBS versus PFF ipsi: −0.9 to −0.4, PBS versus PFF contra: −0.5 to −0.01; SN – PBS versus PFF ipsi:‐0.31 to −0.17, PBS versus PFF contra: −0.28 to −0.15. Scale bars: 22.5 μm (for all panels)