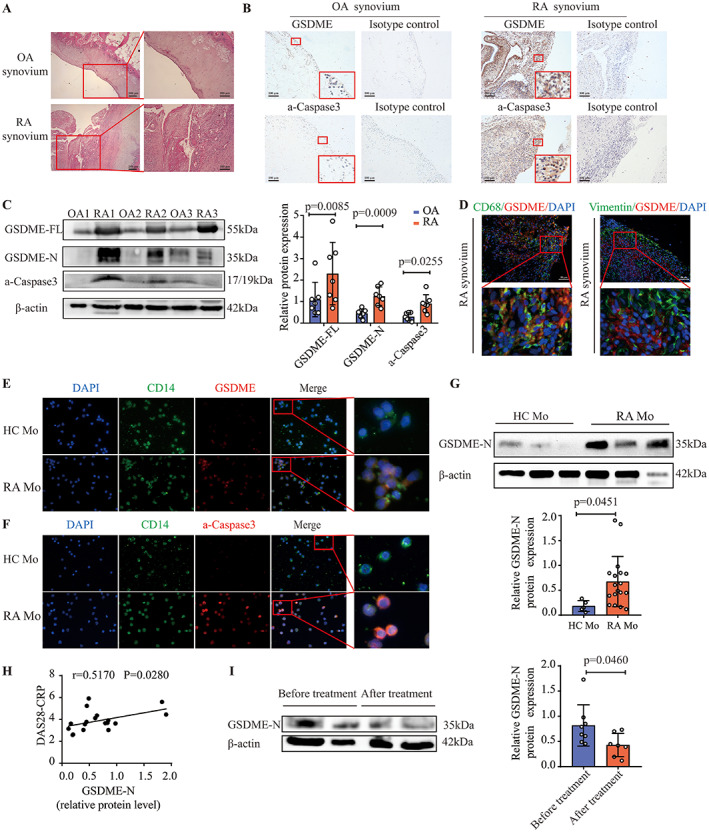
Figure 1.

Increased expression and activation of gasdermin E (GSDME) in synovial macrophages and CD14+ monocytes from patients with rheumatoid arthritis (RA), and positive correlation of GSDME level with RA disease activity. A, Representative images of hematoxylin and eosin–stained synovial tissue samples from patients with osteoarthritis (OA) and patients with RA. Right panels show higher‐magnification views (bars = 100 μm) of the boxed areas in the left panels (bars = 200 μm). B, Representative immunohistochemistry images of GSDME and activated caspase 3 (a‐caspase 3) expression in synovial tissue samples from OA patients (n = 7) and RA patients (n = 7). Lower boxed areas show higher‐magnification views (original magnification × 400) of the upper boxed areas (original magnification × 100). C, Western blot (left) and quantification (right) of the expression of full‐length GSDME (GSDME‐FL), the N‐terminal fragment of GSDME (GSDME‐N), and activated caspase 3 in synovial tissue samples from OA patients (n = 7) and RA patients (n = 7). D, Immunofluorescence images showing the expression of GSDME in CD68‐positive synovial macrophages and vimentin‐positive fibroblasts in synovial tissue samples from RA patients (n = 7). Bottom panels show higher‐magnification views (original magnification × 800) of the boxed areas in the top panels (bars = 50 μm). E and F, Representative images of immunostaining for DAPI, CD14, GSDME, and activated caspase 3 in peripheral blood monocytes (Mo) from healthy controls (HCs) and RA patients. For the merged images, right panels show higher‐magnification views (original magnification × 1600) of the boxed areas in the left panels (original magnification × 400). G, Western blot (top) and quantification (bottom) of GSDME‐N expression in peripheral blood monocytes from healthy controls and RA patients. H, Correlation of GSDME‐N expression, measured by Western blot analysis, in peripheral blood monocytes from RA patients (n = 18) with RA disease activity measured by the Disease Activity Score in 28 joints using the C‐reactive protein level (DAS28‐CRP). I, Western blot (left) and quantification (right) of GSDME‐N expression in peripheral blood monocytes from patients with active RA before treatment (n = 8) and after treatment with combination therapy that included tumor necrosis factor inhibitors (n = 7). In C and G, symbols represent individual subjects; bars show the mean ± SD protein level relative to β‐actin. Color figure can be viewed in the online issue, which is available at http://onlinelibrary.wiley.com/doi/10.1002/art.41963/abstract.
