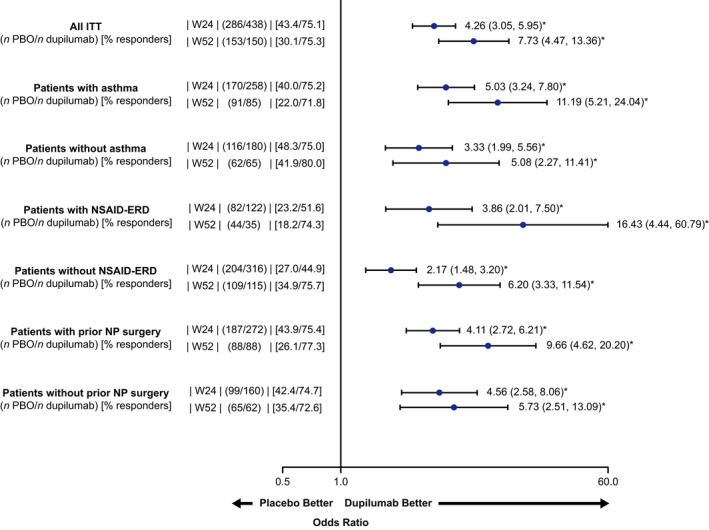
FIGURE 4.

SNOT‐22 total score responder analysis at Weeks 24 and 52 (ITT and subgroups). Treatment responder was defined as an improvement of ≥8.9 from baseline at Weeks 24 and 52 (MCID for SNOT‐22). Odds ratio with 95% confidence interval. *p < .0001, ITT, intention to treat; MCID, minimum clinically important difference; NSAID‐ERD, non‐steroidal anti‐inflammatory drug‐exacerbated respiratory disease; NP, nasal polyp; PBO, placebo; q2w, every 2 weeks; SNOT‐22, 22‐item sino‐nasal outcome test
