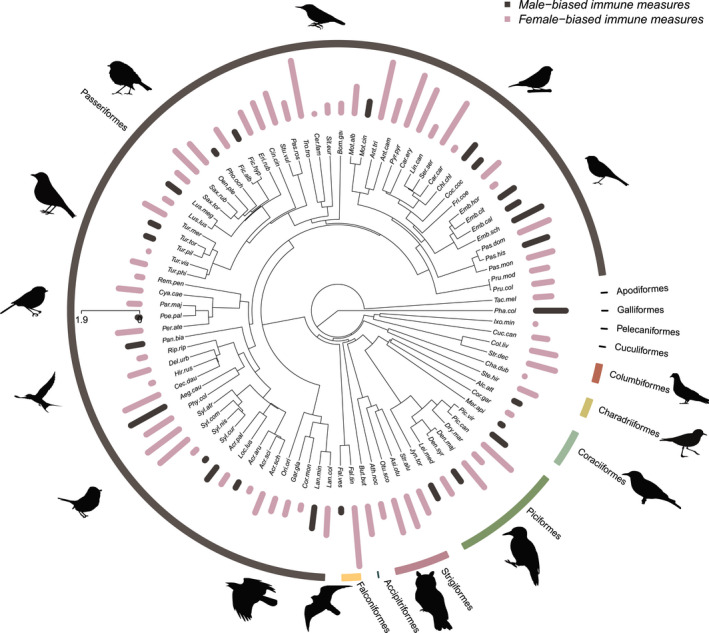
FIGURE 1.

Phylogenetic distribution of sex‐differences in total white blood cell counts, illustrating the phylogenetic coverage of the data and the lack of phylogenetic signal in physiological sex‐specificity in our sample. Female‐bias (marked in pink) in total white blood cell number is more prominent than male‐bias (marked in grey) in our sample. The height of the bars reflects the magnitude of sex difference (i.e. the absolute value of the effect sizes)
