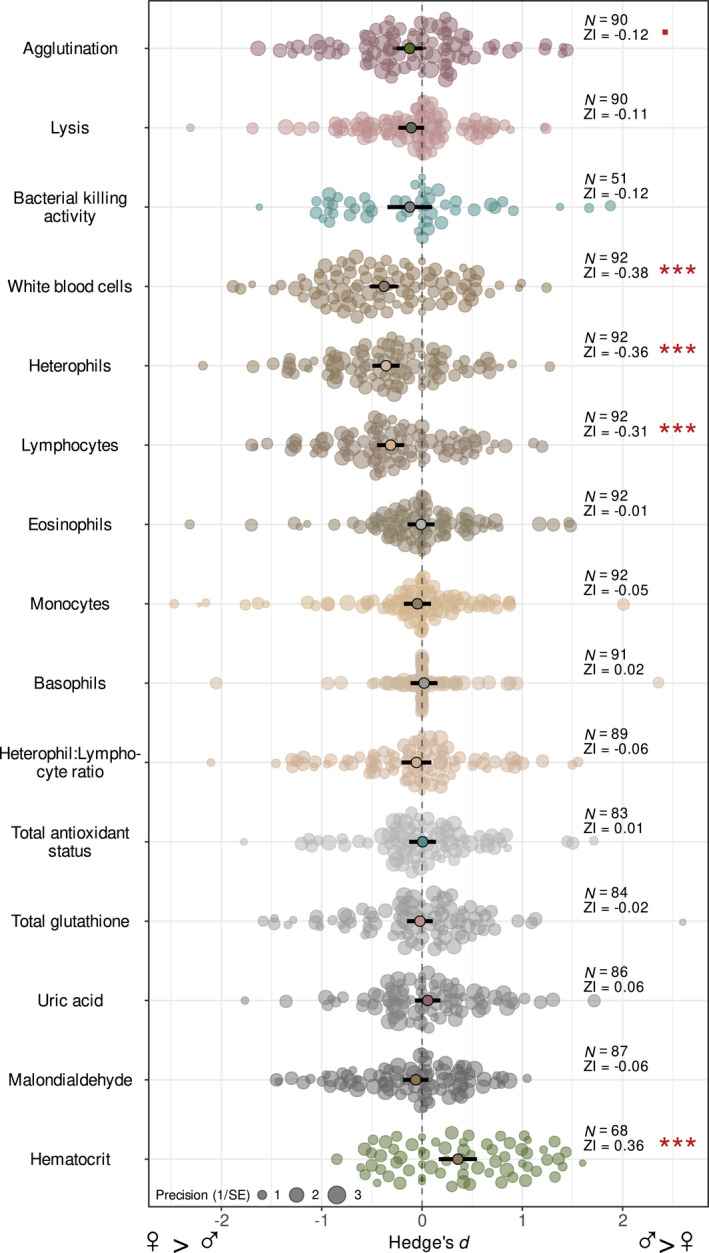
FIGURE 2.

Orchard plot for the intercept only meta‐analytic models showing the overall difference in physiological measures between males and females. Mean effect sizes with confidence intervals (bold lines) are shown in the middle of the dot charts, where individual dots are individual (i.e. species‐specific) effect sizes. The size of dots shows the precision (inverse of standard error) of the effect size estimate of different physiological parameters. Number of species (N), overall effect size (ZI) and p‐value indicating the difference of ZI from zero are given. Negative effect sizes indicate female‐bias (larger values in females), whilst positive values mark male‐bias in the respective parameter. Significance levels are denoted with red as follows: ■ p < 0.1, ***p < 0.0001
