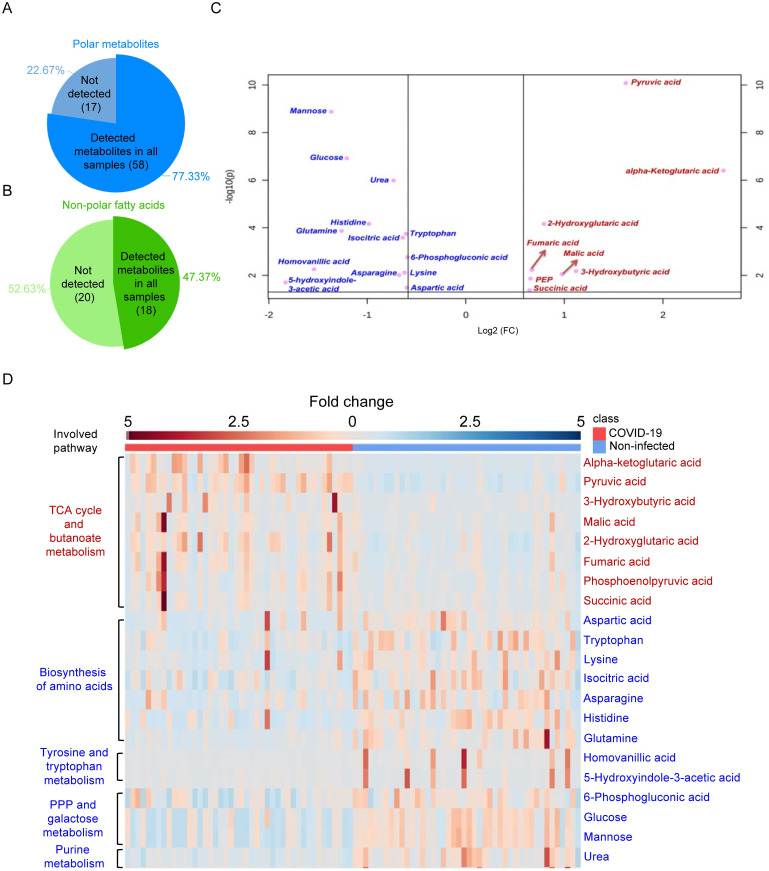
Figure 2.
GS-MS-based targeted metabolomics was used to identify metabolites in COVID-19 patient plasma samples. (A) Pie chart showing the ratio of detected and non-detected polar metabolites using the GC-MS-based targeted metabolites. (B) Pie chart showing the ratio of detected and non-detected non-polar fatty acids using the GC-MS-based targeted metabolites. (C) Overview of the upregulated and downregulated metabolites in COVID-19 patients' plasma. (D) Heatmap showing the upregulated metabolites and their belonged pathways in both COVID-19 patients and non-infected donors.

