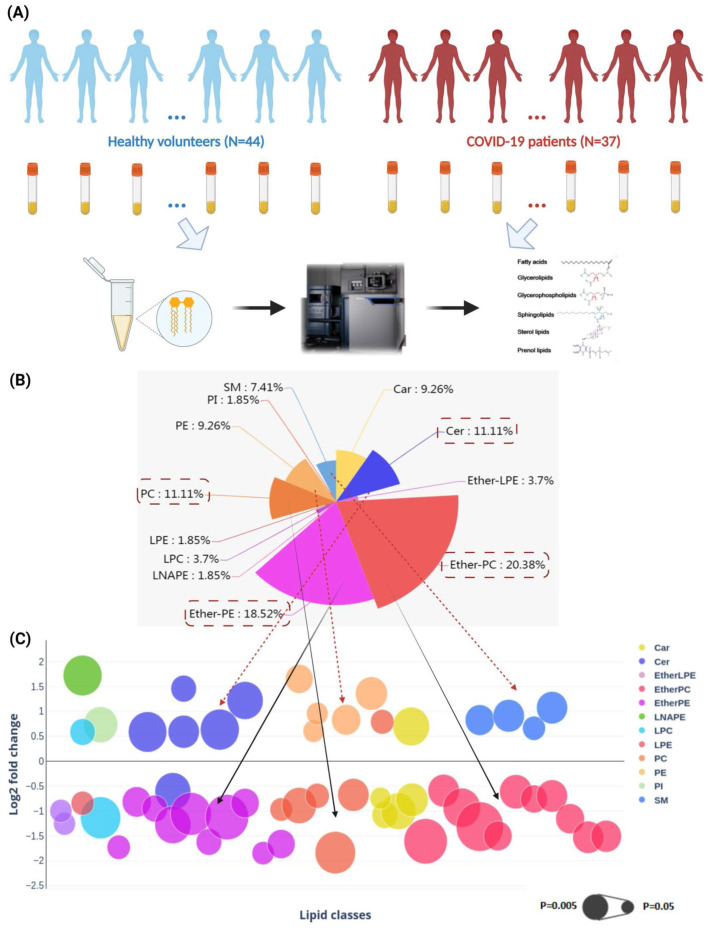
Figure 2.
Perturbed lipids in COVID-19 patients' plasam samples. (A) The schematic of liquid chromatography-mass spectrometry-based lipidomics of COVID-19 patients' and non-infected control subjects' plasma samples. (B) Pie chart and (C) bubble plot showing 12 significantly perturbed lipid classes in COVID-19 patients' plasma samples. The x-axis and the y-axis in the bubble plot reprsent the lipid classes and log2-fold change in the plasma samples of COVID-19 patients compared to those of non-infected control subjects. The size of the bubbles represent the statistical significance of the change (FDR adjusted p-value from multiple t-test with the bigger bubble size representing a smaller p-value). Car, carnitine; Cer, ceramides; EtherLPE, ether-linked lysophosphatidylethanolamine; EtherPC, ether-linked phosphatidylcholine; EtherPE, ether-linked phosphatidylethanolamine; LNAPE, n-acyl-lysophosphatidyl-ethanolamine; LPC, lysophosphatidylcholine; LPE, lysophosphatidylethanolamine; PC, glycerophosphocholines; PE, glycerophosphoethanolamines; PI, glycerophosphoinositols; SM, sphingomyelin.

